IMAGE

Figure 8

ID
ZDB-IMAGE-250728-29
Source
Figures for Boi et al., 2025
Image
Figure Caption

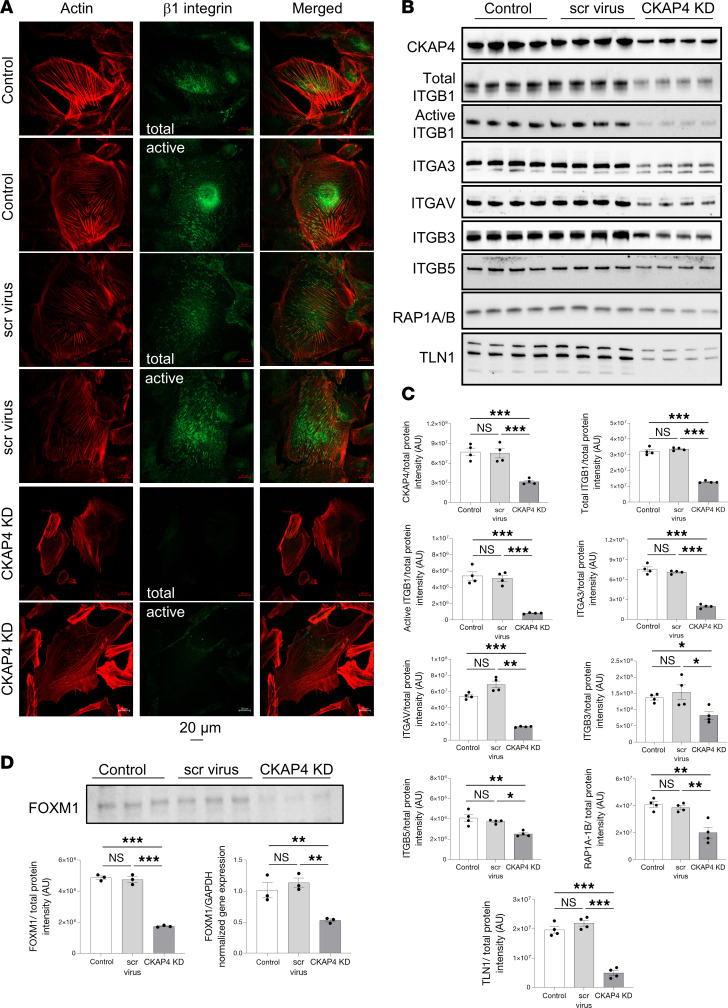
Figure 8 CKAP4 KD causes downregulation of integrins and influences their modulation.

Immunofluorescence images of HPODs (untreated, scr-treated control, and CKAP4 KD cells) with phalloidin (actin cytoskeleton, red) and total and active β1 integrins (green) (A). Western blots of CKAP4, total and active ITGB1, ITGAV, ITGB3, ITGB5, RAP1A/B, and TLN1 are shown (B) along with the respective normalized protein expression graphs (C). Western blots and relative normalized protein expression graph for FOXM1, together with FOXM1 gene expression (D). Unedited/uncropped total protein blots used for normalization calculation are provided as supplemental materials. C: n = 4 per group, Tukey’s post hoc after 1-way ANOVA. *P < 0.05, **P < 0.01, ***P < 0.001. Error bars represent average ± SEM. D: n = 3 per group (both gene and protein expression), Tukey’s post hoc after 1-way ANOVA. **P < 0.01, ***P < 0.001. Error bars represent average ± SEM. AU, arbitrary units; CKAP4, cytoskeleton associated protein 4; FOXM1, forkhead protein M1; KD, knockdown; HPODs, human podocytes; scr, scrambled; ITGB1, integrin β1; ITGAV, integrin αV; ITGB3, integrin β3; ITGB5, integrin β5; RAP1A/B, Ras-related protein Rap-1A/B; TLN1, talin 1.

Acknowledgments
This image is the copyrighted work of the attributed author or publisher, and ZFIN has permission only to display this image to its users. Additional permissions should be obtained from the applicable author or publisher of the image. Full text @ JCI Insight