
|
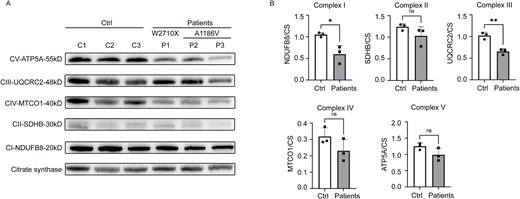
Fig. 2 (A) Western blotting of the five complexes in both the control group and the patients. (B) The analysis graph represents the ratio of the grayscale value of each complex to the grayscale value of the internal reference, citrate synthase. Patients clearly exhibited a significant decrease in complexes I and III. C1, C2, and C3 represent control 1, control 2, and control 3, respectively, whereas P1, P2, and P3 denote patient 1, patient 2, and patient 3, respectively. All the data are shown as the means ± SDs. *P < 0.05, **P < 0.01, ***P < 0.001. Statistical significance was calculated via Student’s two-tailed t test.