
- Title
-
Mitochondrial dysfunction is driven by imbalanced fission and fusion of mitochondria in myofibrillar myopathy type 5
- Authors
- Wu, W., Lv, X., Feng, Y., Yang, M., Yang, G., Zhao, D., Yan, C., Lin, P.
- Source
- Full text @ Hum. Mol. Genet.
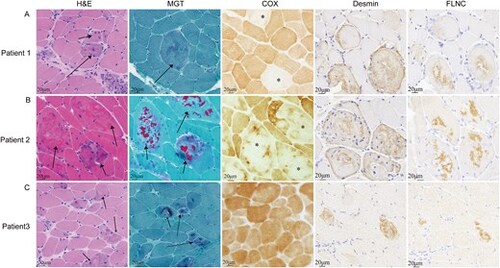
(A) Pathological biopsy and immunohistochemical staining results for patient 1. HE staining of patient 1 revealed mild variation in muscle fibre size, with basophilic material (indicated by arrows). Spherical bodies were observed via MGT staining (indicated by arrows), alongside COX-negative muscle fibres (indicated by *). (B) Pathological biopsy and immunohistochemical staining results for patient 2. Acidophilic material was evident on HE staining (indicated by arrows), cytoplasmic bodies on MGT staining (indicated by arrows), and large irregular areas of COX activity loss were noted within muscle fibres. (C) Pathological biopsy and immunohistochemical staining results for patient 3. HE staining revealed acidophilic material (indicated by arrows), cytoplasmic bodies on MGT staining (indicated by arrows), and no COX enzyme deficiency. Immunohistochemical staining revealed the deposition of desmin and filamin-C in all three patients. |
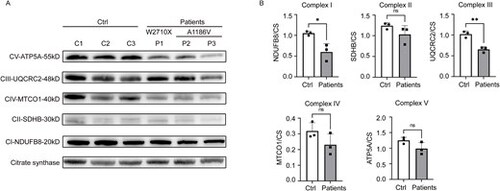
(A) Western blotting of the five complexes in both the control group and the patients. (B) The analysis graph represents the ratio of the grayscale value of each complex to the grayscale value of the internal reference, citrate synthase. Patients clearly exhibited a significant decrease in complexes I and III. C1, C2, and C3 represent control 1, control 2, and control 3, respectively, whereas P1, P2, and P3 denote patient 1, patient 2, and patient 3, respectively. All the data are shown as the means ± SDs. *P < 0.05, **P < 0.01, ***P < 0.001. Statistical significance was calculated via Student’s two-tailed t test. |
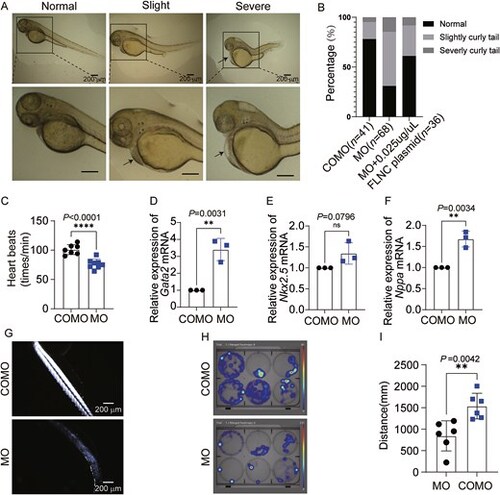
Establishment of the zebrafish model. (A) Three different phenotypes of zebrafish: A normal phenotype with no tail curvature, a mild phenotype with slight tail curvature, and a severe phenotype with pronounced tail curvature. Analysis of heart morphology in zebrafish embryos revealed pericardial edema (indicated by arrow) in both mild and severe phenotypic zebrafish. (B) Statistical analysis of the frequency of each phenotype, which revealed a significant difference. The rescue experiment, conducted through the injection of the FLNC plasmid (0.025 μg/μL) to overexpress FLNC, demonstrated restoration of the curly tail phenotype in zebrafish. (C) Heart rate analysis of zebrafish in the MO and COMO groups. (D–F) to evaluate myocardial involvement, we analyzed the expression of key myocardial developmental genes in the MO group. Upregulation of Nppa, Nkx2.5, and Gata4 has been linked to cardiac developmental defects. Notably, elevated expression of these genes was observed in the MO group. (G) Pictures of zebrafish from the COMO and MO groups under polarized light. (H) Heatmaps of zebrafish swimming distances. (I) Statistical analysis of these distances between the two groups (n = 6). All the data are shown as the means ± SDs. *P < 0.05, **P < 0.01, ***P < 0.001. Statistical significance was calculated via Student’s two-tailed t test. |
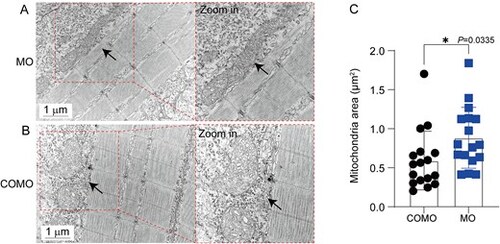
Ultrastructural analysis of MO and COMO zebrafish. (A) Transmission electron microscopy images of the MO group, with arrows indicating abnormally enlarged mitochondria. (B) Transmission electron microscopy images of the COMO group, with arrows indicating normally shaped mitochondria. (C) Statistical analysis revealed a significant increase in the mitochondrial cross-sectional area within the muscle fibers of the MO group zebrafish compared to the COMO group (P = 0.0335). All data are shown as means ± SD. *P < 0.05. Statistical significance is calculated using Student’s two-tailed t test. PHENOTYPE:
|
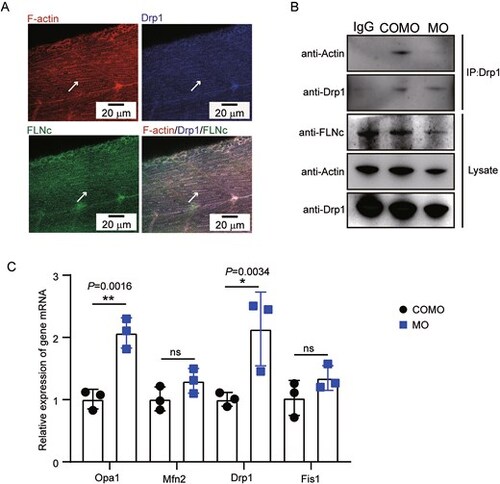
Flnc deficiency resulted in impaired mitochondrial dynamics. (A) Colocalization of F-actin, filamin-C, and Drp1 in wild-type zebrafish. (B) Coimmunoprecipitation of actin and Drp1 from lysates from MO and COMO zebrafish. IgG was used as an IP negative control. The data showed that the ability of Drp1 to bind to actin was weakened in the MO zebrafish. (C) Compared with the CoMO group, the MO group exhibited significantly increased expression of Drp1 and Opa1. All the data are shown as the means ± SDs. *P < 0.05, **P < 0.01, ***P < 0.001. Statistical significance was calculated via Student’s two-tailed t test. |

(A-D) Ndufa9 (located in complex I) protein expression was significantly down-regulated in the MO group. Bnip3l protein expression was significantly elevated in the MO group compared with the COMO group. (E) Figure showing the oxygen consumption rate (OCR) curves of the COMO group and the MO group. The difference in the OCR between the COMO group and the MO group before and after the addition of oligo was significant, and the arrow indicates the time of oligo addition (n = 3). (F) The statistical analysis of ATP production capacity (n = 3). (G) Determination of the basic OCR of zebrafish (n = 3). All the data are shown as the means ± SDs. *P < 0.05, **P < 0.01, ***P < 0.001. Statistical significance was calculated via Student’s two-tailed t test. |
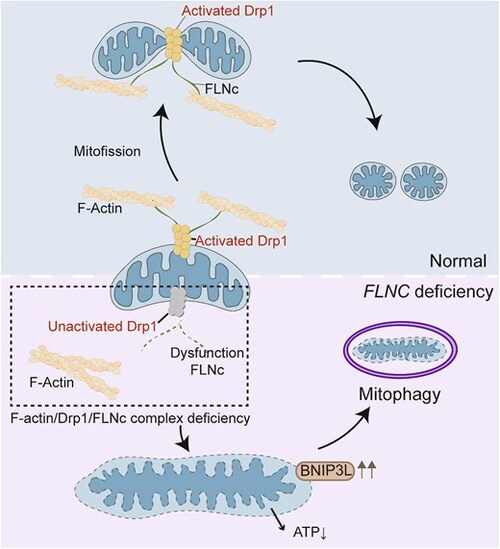
Schematic representation of the direct interaction between filamin-C, Drp1, and F-actin during mitochondrial fission, as well as the consequences of filamin-C deficiency. In the absence of filamin-C, Drp1 remains unactivated, leading to impaired mitochondrial fission. This disruption in fission subsequently results in mitophagy and mitochondrial dysfunction. |