
FIGURE
Fig. 4
- ID
- ZDB-FIG-250729-91
- Publication
- Wu et al., 2025 - Mitochondrial dysfunction is driven by imbalanced fission and fusion of mitochondria in myofibrillar myopathy type 5
- Other Figures
- All Figure Page
- Back to All Figure Page
Fig. 4
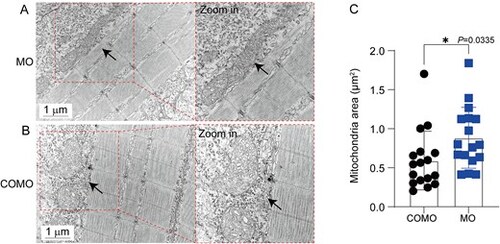
Ultrastructural analysis of MO and COMO zebrafish. (A) Transmission electron microscopy images of the MO group, with arrows indicating abnormally enlarged mitochondria. (B) Transmission electron microscopy images of the COMO group, with arrows indicating normally shaped mitochondria. (C) Statistical analysis revealed a significant increase in the mitochondrial cross-sectional area within the muscle fibers of the MO group zebrafish compared to the COMO group (P = 0.0335). All data are shown as means ± SD. *P < 0.05. Statistical significance is calculated using Student’s two-tailed t test. |
Expression Data
Expression Detail
Antibody Labeling
Phenotype Data
| Fish: | |
|---|---|
| Knockdown Reagents: | |
| Observed In: | |
| Stage: | Long-pec |
Phenotype Detail
Acknowledgments
This image is the copyrighted work of the attributed author or publisher, and
ZFIN has permission only to display this image to its users.
Additional permissions should be obtained from the applicable author or publisher of the image.
Full text @ Hum. Mol. Genet.