
Image
|
Figure Caption
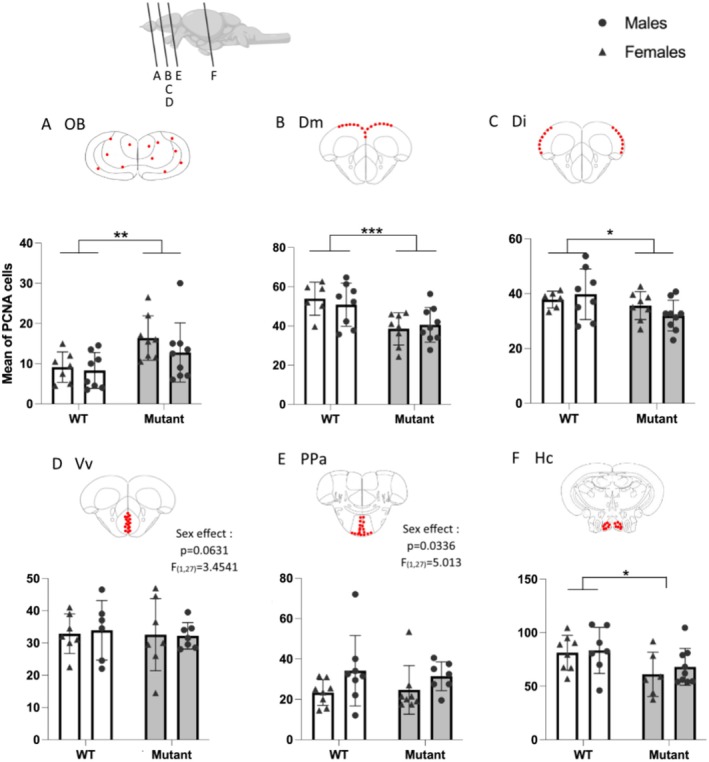
FIGURE 4
Quantification of the number of PCNA‐labeled cells in WT and mutant fish. (A) Olfactory bulbs (OB). (B) Medial zone of dorsal telencephalic area (Dm). (C) Lateral zone of dorsal telencephalic area (Di). (D) Ventral nucleus of ventral telencephalic area (Vv). (E) Parvocellular preoptic nucleus (PPa). (F) Caudal zone of periventricular hypothalamus (Hc). Red dots on schematic frontal sections indicate quantified areas. Mean ± SEM, *
Acknowledgments
This image is the copyrighted work of the attributed author or publisher, and
ZFIN has permission only to display this image to its users.
Additional permissions should be obtained from the applicable author or publisher of the image.
Full text @ J. Neurochem.