
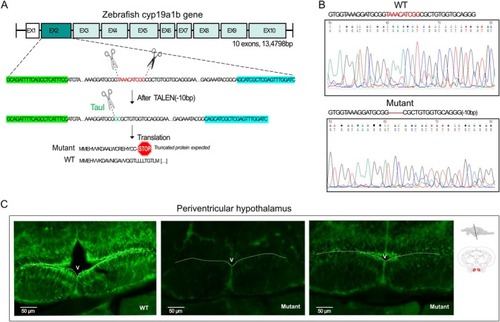
- Title
-
Mutation of Brain Aromatase Impairs Behavior and Neuroplasticity in Adult Zebrafish
- Authors
- Malleret, C., Blanc-Legendre, M., Guillot, L., Lautrette-Quinveros, H., Pavlidi, P., Dalla, C., Kokras, N., Brion, F., Toupin, M., Chalmel, F., Cousin, X., Charlier, T.D., Pellegrini, E.
- Source
- Full text @ J. Neurochem.
C |
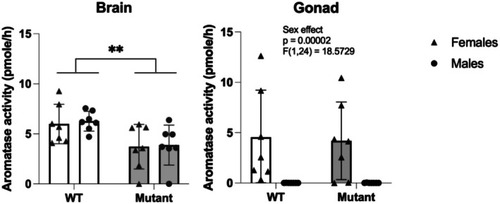
Aromatase activity expressed in pmole per hour in the brain and the gonad of WT and mutant adult zebrafish, in males and females. |
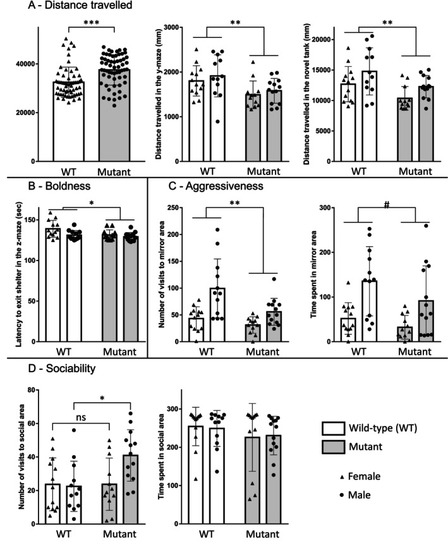
Non‐reproductive behavior in WT and mutant adult fish: Distance traveled in the shoaling test, the y‐maze, and the novel tank diving test (A). Boldness measured by the latency to exit the shelter area in the z‐maze (B). Aggressiveness test with the number of visits and the time spent in the mirror area (C). Sociability is measured by the number of visits and the time spent in the social area (D). Data are shown as mean ± SEM. * |
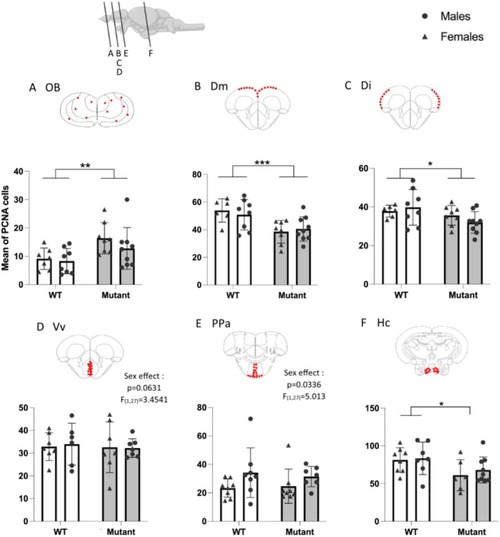
Quantification of the number of PCNA‐labeled cells in WT and mutant fish. (A) Olfactory bulbs (OB). (B) Medial zone of dorsal telencephalic area (Dm). (C) Lateral zone of dorsal telencephalic area (Di). (D) Ventral nucleus of ventral telencephalic area (Vv). (E) Parvocellular preoptic nucleus (PPa). (F) Caudal zone of periventricular hypothalamus (Hc). Red dots on schematic frontal sections indicate quantified areas. Mean ± SEM, * |
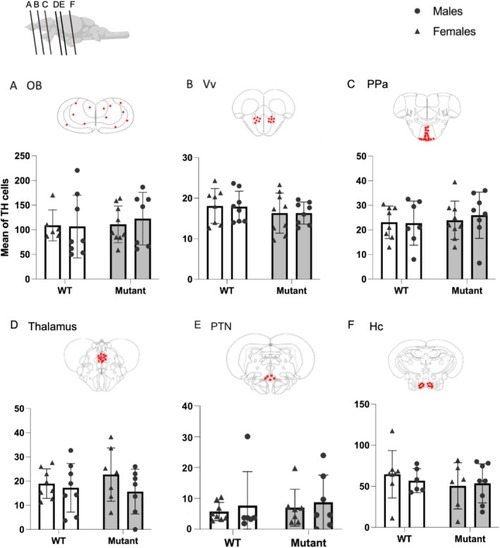
Quantification of TH‐positive cells in WT and mutant fish. (A) Olfactory bulbs (OB). (B) Ventral nucleus of ventral telencephalic area (Vv). (C) Parvocellular preoptic nucleus (PPa). (D) Thalamus. (E) Posterior tuberal nucleus (PTN). (F) Caudal zone of periventricular hypothalamus (Hc). Red plots represent regions of interest in which TH‐positive cells have been quantified. Mean ± SEM; the number of analyzed brains is indicated in each bar. |
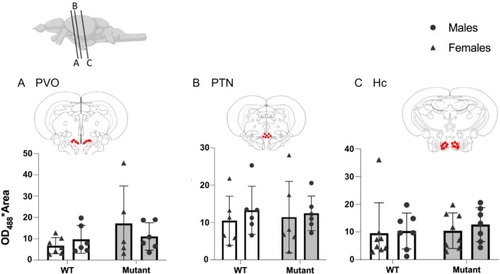
Expression of 5‐HT in positive cells in WT and mutant fish. (A) Paraventricular organ (PVO). (B) Posterior tuberal nucleus (PTN). (C) Caudal zone of periventricular hypothalamus (Hc). Red dots on frontal brain section drawings indicate areas of interest where expression is observed. Mean ± SEM. |
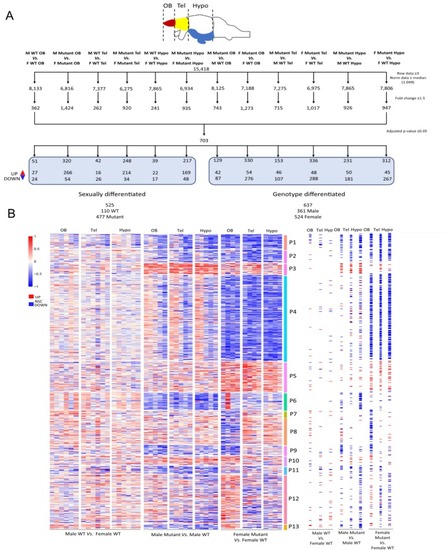
Workflow for BRB‐Seq data processing and heatmap of differentially expressed genes (DEGs) in the three different parts of the brain (olfactory bulb, telencephalon, and hypothalamus) on male and female WT and mutant adult fish. (A) Filtration steps based on limit of detection, fold change cut‐off of 1.5, and statistics leading to 703 DEGs. Hypo, hypothalamus; OB, olfactory bulb; Tel, telencephalon. (B) Heatmap of all DEGs in each WT and mutant fish in the three areas of the brain. Genes are clustered in 13 distinct patterns: P1. 36 DEGs, P2. 31 DEGs, P3. 27 DEGs, P4. 213 DEGs, P5. 74 DEGs, P6. 43 DEGs, P7. 15 DEGs, P8. 66 DEGs, P9. 24 DEGs, P10. 23 DEGs, P11. 19 DEGs, P12. 120 DEGs, P13. 12 DEGs. On the right‐hand side of the heatmap, each dysregulated gene is represented as a tile, with a color intensity reflecting the average log2 fold change of samples for each comparison and brain region. Scale: Log2 fold change. Red = significantly upregulated expression, Blue = significantly downregulated expression, White = no significant change. Male: |
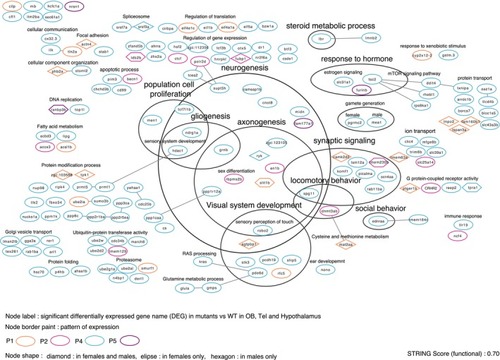
Functional interaction and annotation of genes from patterns (Figure |
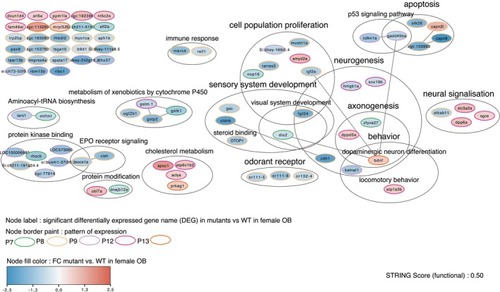
Cytoscape network visualization: Functional interaction (STRING functional score: 0.50) and annotation of genes from pattern of expression (described in Figure |