
|
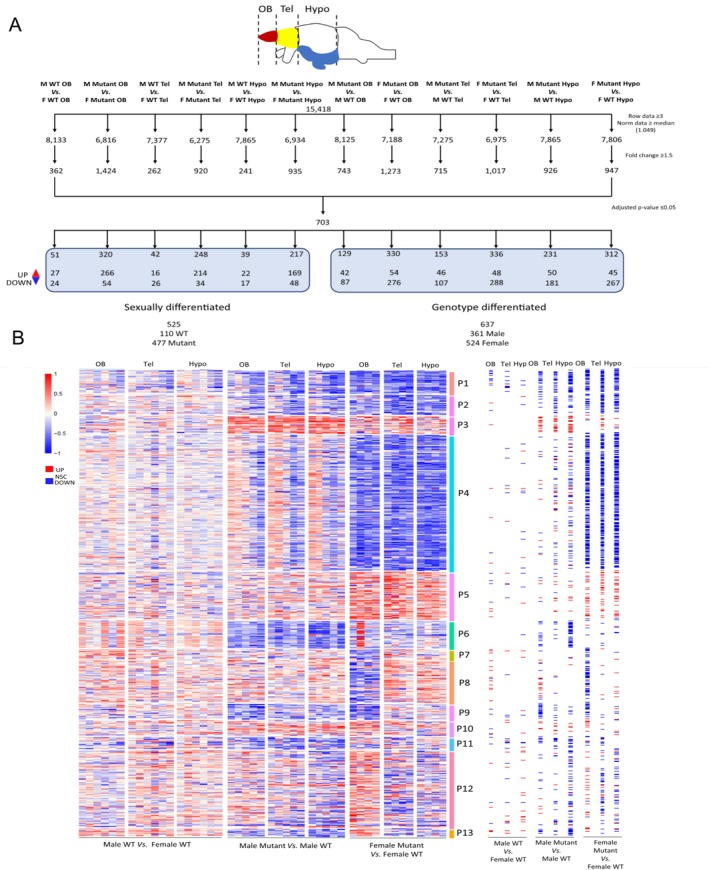
FIGURE 7
Workflow for BRB‐Seq data processing and heatmap of differentially expressed genes (DEGs) in the three different parts of the brain (olfactory bulb, telencephalon, and hypothalamus) on male and female WT and mutant adult fish. (A) Filtration steps based on limit of detection, fold change cut‐off of 1.5, and statistics leading to 703 DEGs. Hypo, hypothalamus; OB, olfactory bulb; Tel, telencephalon. (B) Heatmap of all DEGs in each WT and mutant fish in the three areas of the brain. Genes are clustered in 13 distinct patterns: P1. 36 DEGs, P2. 31 DEGs, P3. 27 DEGs, P4. 213 DEGs, P5. 74 DEGs, P6. 43 DEGs, P7. 15 DEGs, P8. 66 DEGs, P9. 24 DEGs, P10. 23 DEGs, P11. 19 DEGs, P12. 120 DEGs, P13. 12 DEGs. On the right‐hand side of the heatmap, each dysregulated gene is represented as a tile, with a color intensity reflecting the average log2 fold change of samples for each comparison and brain region. Scale: Log2 fold change. Red = significantly upregulated expression, Blue = significantly downregulated expression, White = no significant change. Male: