
Image
|
Figure Caption
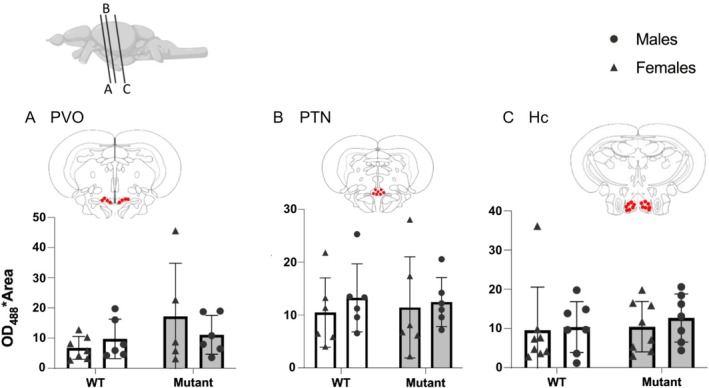
FIGURE 6
Expression of 5‐HT in positive cells in WT and mutant fish. (A) Paraventricular organ (PVO). (B) Posterior tuberal nucleus (PTN). (C) Caudal zone of periventricular hypothalamus (Hc). Red dots on frontal brain section drawings indicate areas of interest where expression is observed. Mean ± SEM.
Acknowledgments
This image is the copyrighted work of the attributed author or publisher, and
ZFIN has permission only to display this image to its users.
Additional permissions should be obtained from the applicable author or publisher of the image.
Full text @ J. Neurochem.