
Image
|
Figure Caption
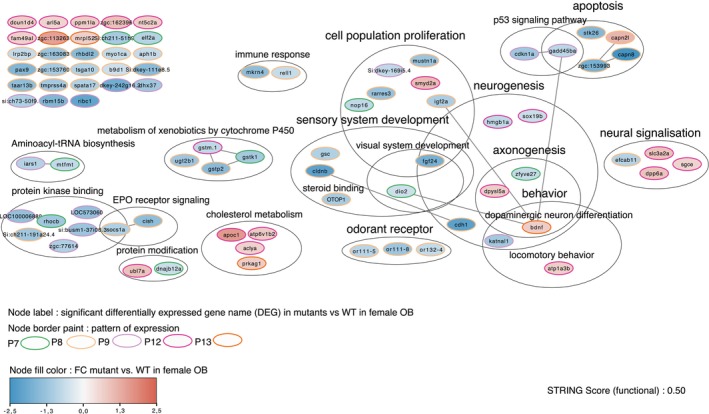
FIGURE 9
Cytoscape network visualization: Functional interaction (STRING functional score: 0.50) and annotation of genes from pattern of expression (described in Figure
Acknowledgments
This image is the copyrighted work of the attributed author or publisher, and
ZFIN has permission only to display this image to its users.
Additional permissions should be obtained from the applicable author or publisher of the image.
Full text @ J. Neurochem.