
|
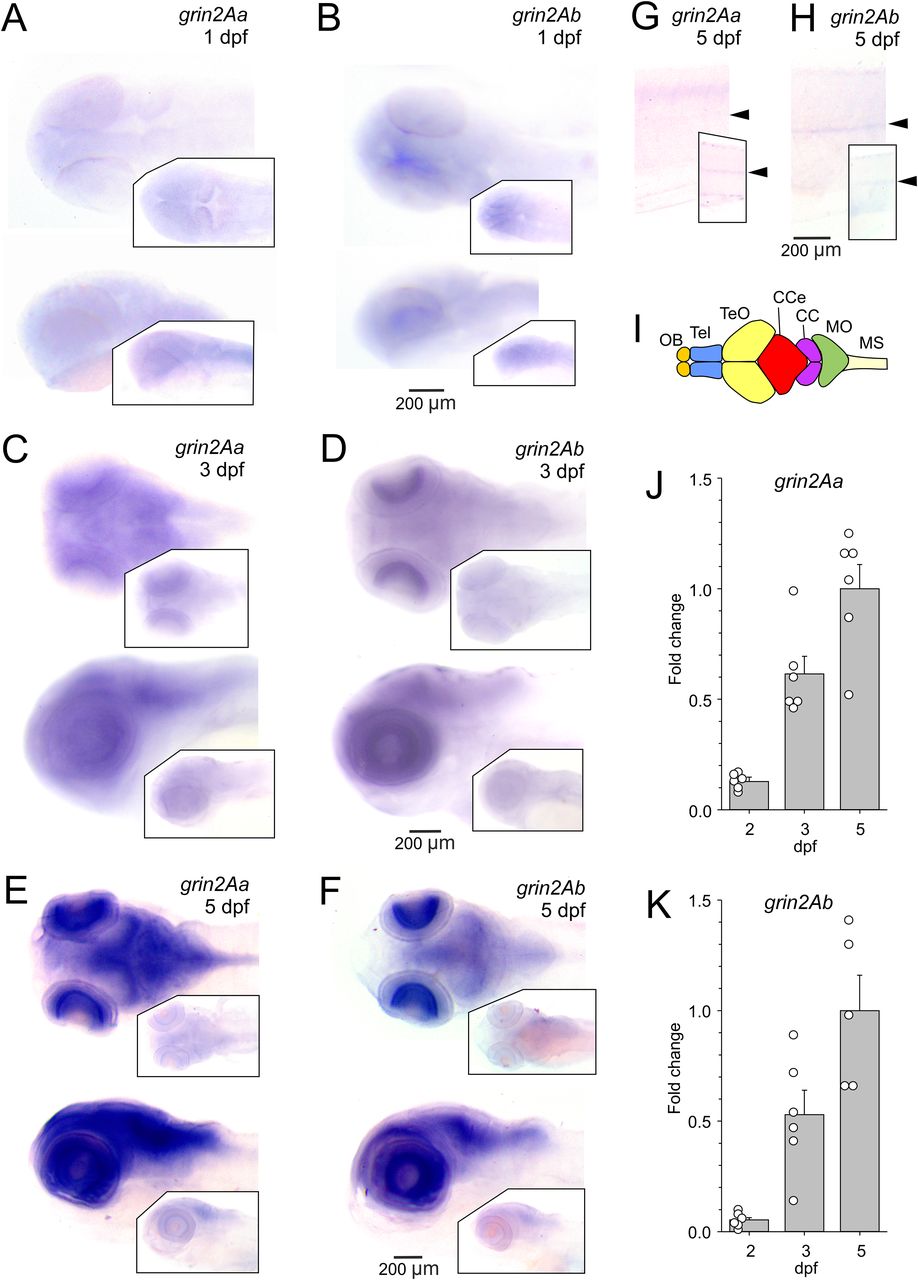
Fig. 2 Expression of grin2Aa and grin2Ab in the zebrafish nervous system. Whole-mount ISH of grin2Aa and grin2Ab at 1 dpf (A, B), 3 dpf (C, D), and 5 dpf (E, F) showing dorsal (top) and lateral (bottom) views. A, C, E, Insets, sense probes of grin2Aa. B, D, F, Insets, sense probes of grin2Ab. G, H, Lateral view of the trunk at 5 dpf for grin2Aa (G) and grin2Ab (H). The position of the spinal cord is indicated by arrows. Insets, Sense probes of grin2Aa and grin2Ab. I, Simplified representation of the zebrafish central nervous system and its major structures. Adapted from Wullimann et al. (1996); CC, crista cerebellaris; CCe, corpus cerebelli; MO, medulla oblongata; MS, medulla spinalis; OB, olfactory bulb; Tel, telencephalon; TeO, tectum opticum. J, K, Relative expression levels of grin2Aa and grin2Ab mRNA at 2 dpf (n = 6; 6), 3 dpf (n = 6; 6), and 5 dpf (n = 6; 5) in the head of zebrafish larvae analyzed using RT-qPCR. Results are normalized to the corresponding gene expression at 5 dpf. For mRNA expression levels of grin1 and grin2B paralogs in the zebrafish nervous system, see Extended Data Figure 2-1.