
Image
|
Figure Caption
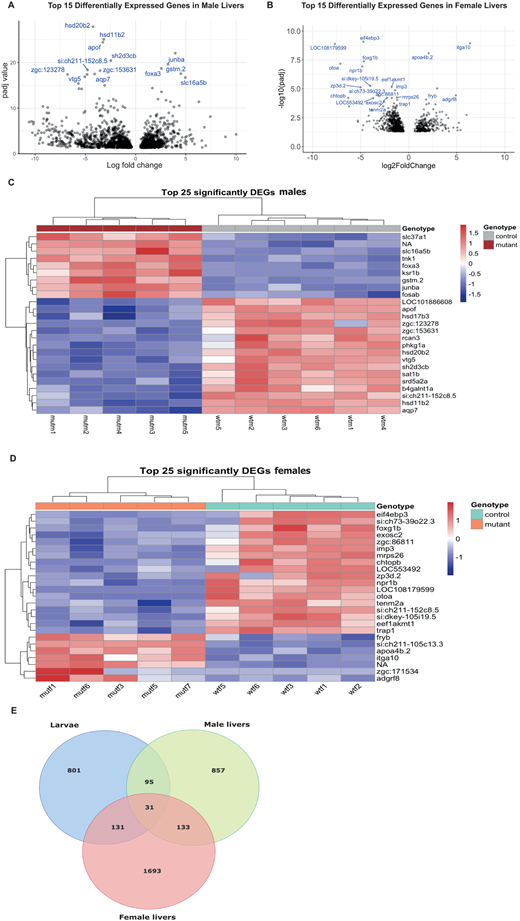
Fig. 3 Differential gene expression in the cyp21a2−/−adult livers. (A,B) Volcano plot showing the top 25 DEGs in mutant livers in males (A) and females (B), with statistical significance (P-adj) represented on the vertical axis and the LFC on the horizontal one. (C,D) Heatmap indicating the top 25 DEGs in mutant livers in males (C) and females (D). (E) Venn diagram showing all the genes that were differentially expressed in mutant larvae (blue), adult male livers (green) and female livers (red), and their overlap between the three groups.
Acknowledgments
This image is the copyrighted work of the attributed author or publisher, and
ZFIN has permission only to display this image to its users.
Additional permissions should be obtained from the applicable author or publisher of the image.
Full text @ Biol. Open