
- Title
-
Steroid 21-hydroxylase deficiency dysregulates essential molecular pathways of metabolism and energy provision
- Authors
- Bacila, I., Oberski, L., Li, N., Storbeck, K.H., Cunliffe, V.T., Krone, N.
- Source
- Full text @ Biol. Open
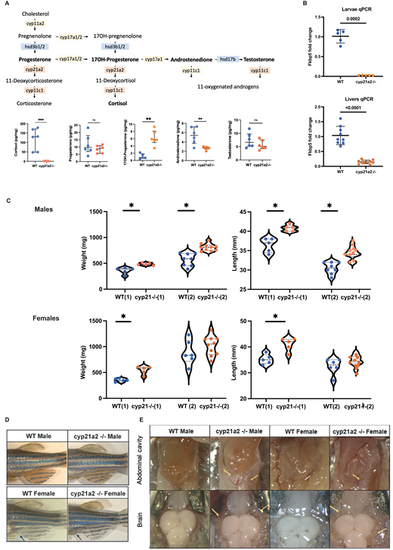
Adult cyp21a2−/−mutant zebrafish phenotype. (A) Diagram of intrrenal steroid biosynthesis in zebrafish (above) and whole-body steroid measurements in mutant fish (orange) compared to WT (blue). The horizontal lines represent median with interquartile range. n=6 fish per group. (B) Expression of fkbp5 in larvae and adult livers. Comparison of whole-body steroids between WT (blue) and mutant (orange). (C) Weight and length measurements in cyp21a2 male zebrafish, WT (blue) and mutant (orange). The numbers in brackets correspond to two different fish populations. (D) External phenotypes of cyp21a2 mutant and WT sibling fish. (E) Dissection images. The upper pictures show the abdominal visceral fat flanking the gastrointestinal tract. The lower images were obtained on dissecting the skull, visualising the brain and the subcutaneous fat around it. The visceral and subcutaneous fat is indicated by yellow arrows (*indicates statistical significance). PHENOTYPE:
|
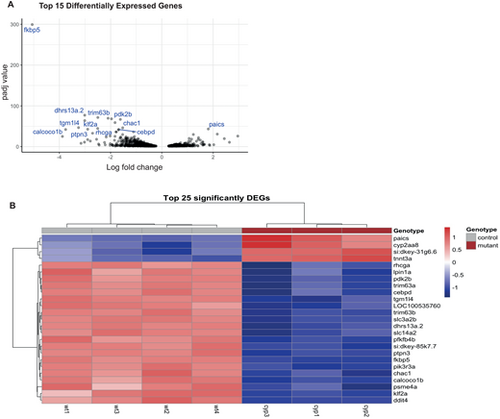
Differential gene expression in cyp21a2−/−larvae. (A) Volcano plot showing the top 25 DEGs in cyp21a2−/− larvae, with statistical significance (P-adj) represented on the vertical axis and the LFC on the horizontal axis. (B) Heatmap and table indicating the top 25 DEGs in cyp21a2−/− larvae. |
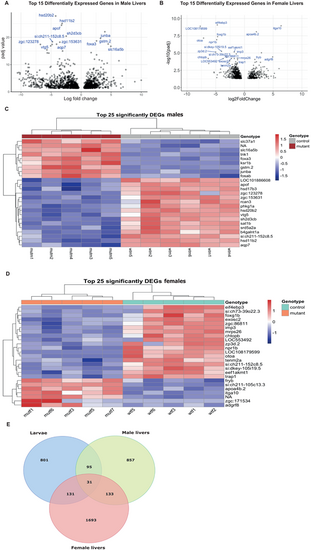
Differential gene expression in the cyp21a2−/−adult livers. (A,B) Volcano plot showing the top 25 DEGs in mutant livers in males (A) and females (B), with statistical significance (P-adj) represented on the vertical axis and the LFC on the horizontal one. (C,D) Heatmap indicating the top 25 DEGs in mutant livers in males (C) and females (D). (E) Venn diagram showing all the genes that were differentially expressed in mutant larvae (blue), adult male livers (green) and female livers (red), and their overlap between the three groups. |
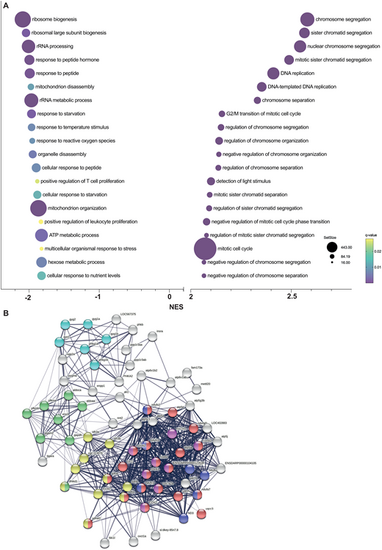
Gene set enrichment analysis in cyp21a2−/−larvae. (A) The top 20 dysregulated biological processes found by the GSEA. Bubbleplot produced in GraphPad Prism showing the 20 most downregulated (left) and upregulated (right) biological processes in cyp21a2 larvae, based exclusively on the normalised enrichment score (NES). The size of the dots indicates the size of the gene set, and the colour corresponds to the q-value, decreasing from yellow to violet. (B) Visualisation in STRING of interactions between proteins encoded by genes involved in ATP metabolism whose expression is dysregulated in cyp21a2−/− mutant larvae. The connecting lines indicate interactions between proteins, the width of the lines being proportional to the confidence or the strength of data supporting the interaction. The colours of the nodes indicate the main sub-processes to which they belong: oxidative phosphorylation (red, number of proteins, n=20), NADH dehydrogenase (ubiquinone) activity (dark blue, n=7), cytochrome-c oxidase activity (pink, n=8), tricarboxylic acid cycle (yellow, n=10), glycogen metabolism (light blue, n=6) and glycolytic process (green, n=8). |
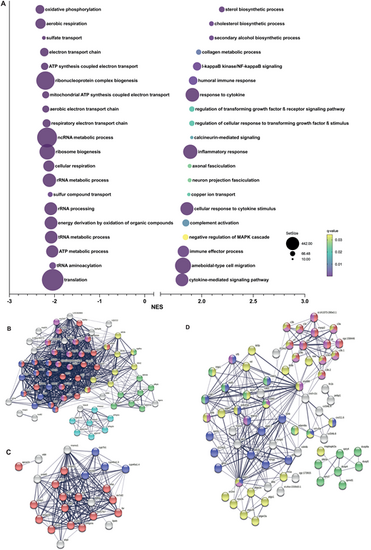
Gene set enrichment analysis in cyp21a2−/−male livers. (A) The top 20 dysregulated biological processes found by the GSEA. Bubbleplot produced GraphPad Prism showing the 20 most downregulated (left) and upregulated (right) biological processes in cyp21a2 male livers, based exclusively on the NES. The size of the dots indicates the size of the gene set, and the colour corresponds to the q-value, decreasing from yellow to violet. (B-D) Visualisation in STRING of interactions between proteins encoded by genes involved in biological processes (colours of the nodes indicate the main sub-processes to which they belong). (B) ATP metabolism: all oxidative phosphorylation (red, n=29), NADH dehydrogenase (ubiquinone) activity (dark blue, n=12), cytochrome-c oxidase activity (pink, n=12), tricarboxylic acid cycle (yellow, n=9), glycogen metabolism (light blue, n=7) and glycolytic process (green, n=8). (C) Sterol synthesis (red, n=15), proteins with steroid hydroxylase activity (blue, n=4). (D) Immune response and MAPK signalling: immune effector process (pink, n=21), complement activation (red, n=13), inflammatory response (yellow, n=36), cytokine mediated signalling pathway (blue, n=18) and regulation of MAPK cascade (green, n=17). |
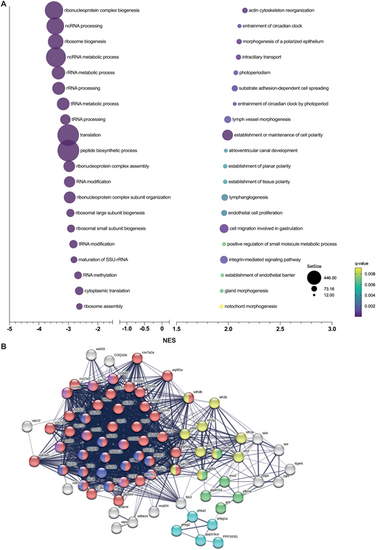
Gene set enrichment analysis in cyp21a2−/−female livers. (A) The top 20 dysregulated biological processes found by the GSEA. Bubbleplot produced GraphPad Prism showing the 20 most downregulated (left) and upregulated (right) biological processes in cyp21a2 female livers, based exclusively on the NES. The size of the dots indicates the size of the gene set, and the colour corresponds to the q-value, decreasing from yellow to violet. (B) Visualisation in STRING of interactions between proteins encoded by genes involved in ATP metabolism whose expression is dysregulated in cyp21a2−/− adult female livers. The colours of the nodes indicate the main sub-processes to which they belong: all oxidative phosphorylation (red, n=44), NADH dehydrogenase (ubiquinone) activity (dark blue, n=13), cytochrome-c oxidase activity (pink, n=7), tricarboxylic acid cycle (yellow, n=10), glycogen metabolism (light blue, n=5) and glycolytic process (green, n=6). |
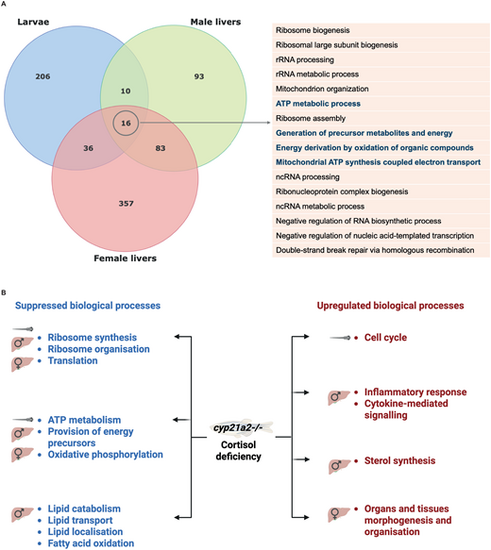
Summary of the GSEA results in the cyp21a2−/− zebrafish mutant. (A) Overlap between the biological processes that were overexpressed in cyp21a2−/− mutant larvae and adult male livers. The upper Venn diagram shows all the genes that were differentially expressed in mutant larvae (blue) and adult male livers (red). The table on the right presents the 16 processes that were significantly dysregulated in all three groups. (B) The main dysregulations of biological processes as a results of cortisol deficiency in the cyp21a2−/− mutant larvae, male and female livers. |
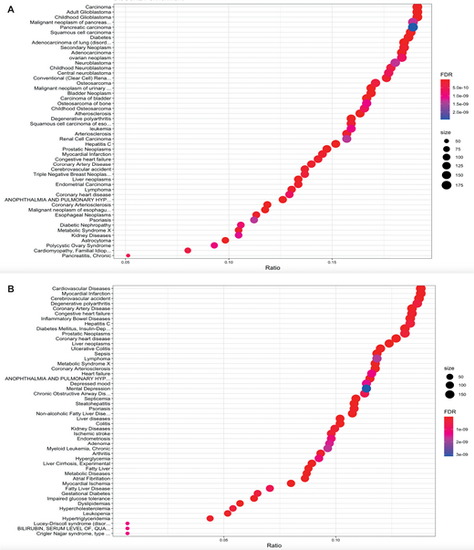
Associations between the cyp21a2−/−transcriptome and human disease in larvae (A) and male adult livers (B). Enrichment plot showing the associations between the transcriptomic changes in cyp21a2−/− mutants and human diseases, produced in R using the ‘disgenet2r’ package. The horizontal axis shows the ratio between the number of DEGs in a category and all DGEs, the size of the dots represents the number of DEGs in a category and the colour, the P-adj value. |