
Fig. 6
- ID
- ZDB-IMAGE-250922-19
- Publication
- Bacila et al., 2025 - Steroid 21-hydroxylase deficiency dysregulates essential molecular pathways of metabolism and energy provision
- All Figures
- Figures for Bacila et al., 2025
|
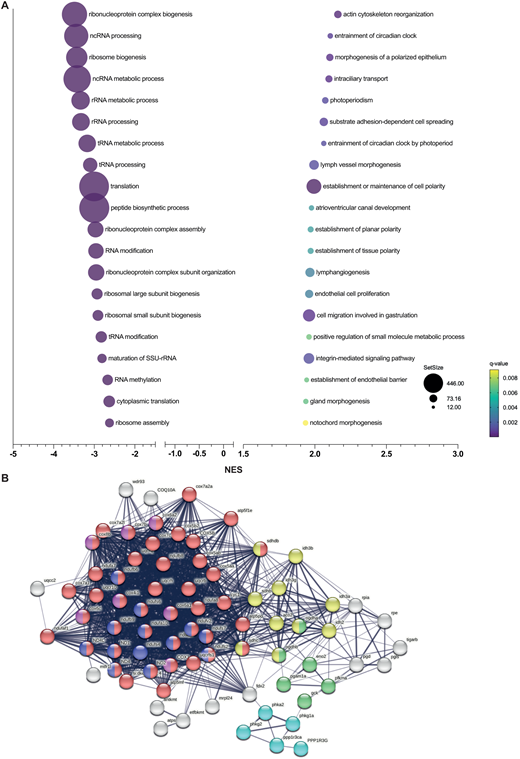
Fig. 6 Gene set enrichment analysis in cyp21a2−/−female livers. (A) The top 20 dysregulated biological processes found by the GSEA. Bubbleplot produced GraphPad Prism showing the 20 most downregulated (left) and upregulated (right) biological processes in cyp21a2 female livers, based exclusively on the NES. The size of the dots indicates the size of the gene set, and the colour corresponds to the q-value, decreasing from yellow to violet. (B) Visualisation in STRING of interactions between proteins encoded by genes involved in ATP metabolism whose expression is dysregulated in cyp21a2−/− adult female livers. The colours of the nodes indicate the main sub-processes to which they belong: all oxidative phosphorylation (red, n=44), NADH dehydrogenase (ubiquinone) activity (dark blue, n=13), cytochrome-c oxidase activity (pink, n=7), tricarboxylic acid cycle (yellow, n=10), glycogen metabolism (light blue, n=5) and glycolytic process (green, n=6).