|
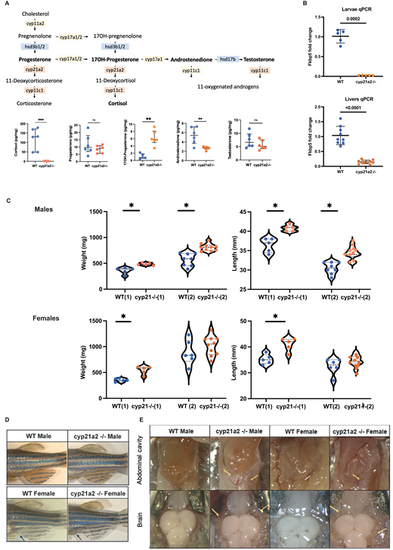
Adult cyp21a2−/−mutant zebrafish phenotype. (A) Diagram of intrrenal steroid biosynthesis in zebrafish (above) and whole-body steroid measurements in mutant fish (orange) compared to WT (blue). The horizontal lines represent median with interquartile range. n=6 fish per group. (B) Expression of fkbp5 in larvae and adult livers. Comparison of whole-body steroids between WT (blue) and mutant (orange). (C) Weight and length measurements in cyp21a2 male zebrafish, WT (blue) and mutant (orange). The numbers in brackets correspond to two different fish populations. (D) External phenotypes of cyp21a2 mutant and WT sibling fish. (E) Dissection images. The upper pictures show the abdominal visceral fat flanking the gastrointestinal tract. The lower images were obtained on dissecting the skull, visualising the brain and the subcutaneous fat around it. The visceral and subcutaneous fat is indicated by yellow arrows (*indicates statistical significance).
|