
|
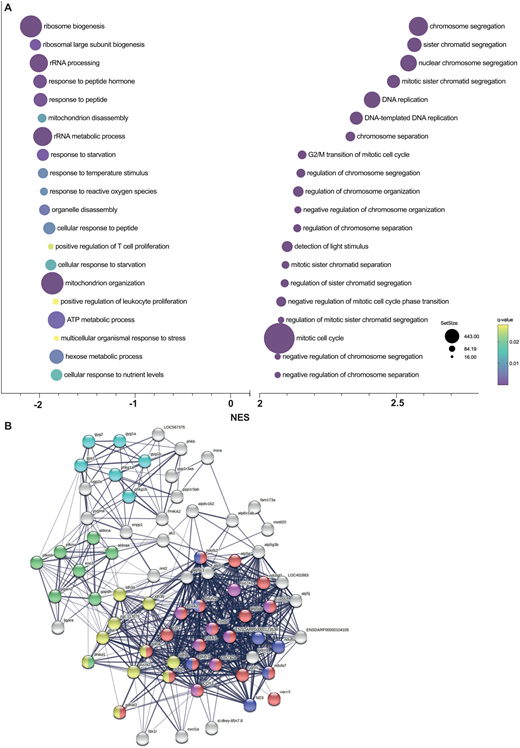
Fig. 4 Gene set enrichment analysis in cyp21a2−/−larvae. (A) The top 20 dysregulated biological processes found by the GSEA. Bubbleplot produced in GraphPad Prism showing the 20 most downregulated (left) and upregulated (right) biological processes in cyp21a2 larvae, based exclusively on the normalised enrichment score (NES). The size of the dots indicates the size of the gene set, and the colour corresponds to the q-value, decreasing from yellow to violet. (B) Visualisation in STRING of interactions between proteins encoded by genes involved in ATP metabolism whose expression is dysregulated in cyp21a2−/− mutant larvae. The connecting lines indicate interactions between proteins, the width of the lines being proportional to the confidence or the strength of data supporting the interaction. The colours of the nodes indicate the main sub-processes to which they belong: oxidative phosphorylation (red, number of proteins, n=20), NADH dehydrogenase (ubiquinone) activity (dark blue, n=7), cytochrome-c oxidase activity (pink, n=8), tricarboxylic acid cycle (yellow, n=10), glycogen metabolism (light blue, n=6) and glycolytic process (green, n=8).