
|
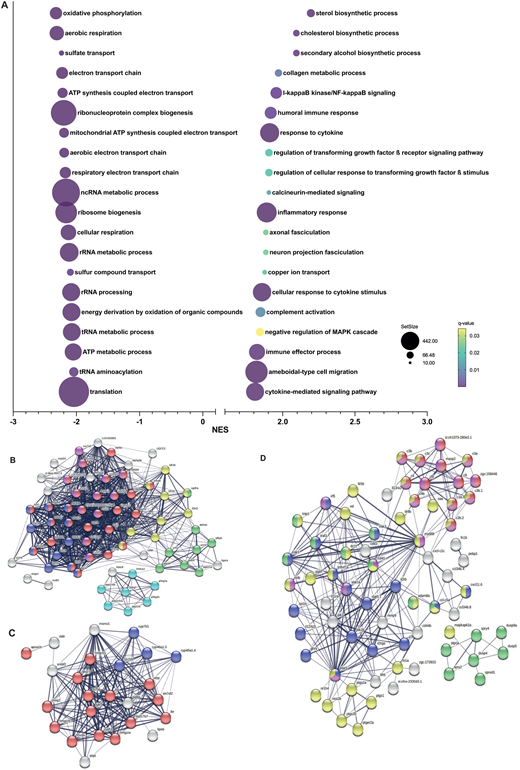
Fig. 5 Gene set enrichment analysis in cyp21a2−/−male livers. (A) The top 20 dysregulated biological processes found by the GSEA. Bubbleplot produced GraphPad Prism showing the 20 most downregulated (left) and upregulated (right) biological processes in cyp21a2 male livers, based exclusively on the NES. The size of the dots indicates the size of the gene set, and the colour corresponds to the q-value, decreasing from yellow to violet. (B-D) Visualisation in STRING of interactions between proteins encoded by genes involved in biological processes (colours of the nodes indicate the main sub-processes to which they belong). (B) ATP metabolism: all oxidative phosphorylation (red, n=29), NADH dehydrogenase (ubiquinone) activity (dark blue, n=12), cytochrome-c oxidase activity (pink, n=12), tricarboxylic acid cycle (yellow, n=9), glycogen metabolism (light blue, n=7) and glycolytic process (green, n=8). (C) Sterol synthesis (red, n=15), proteins with steroid hydroxylase activity (blue, n=4). (D) Immune response and MAPK signalling: immune effector process (pink, n=21), complement activation (red, n=13), inflammatory response (yellow, n=36), cytokine mediated signalling pathway (blue, n=18) and regulation of MAPK cascade (green, n=17).