
|
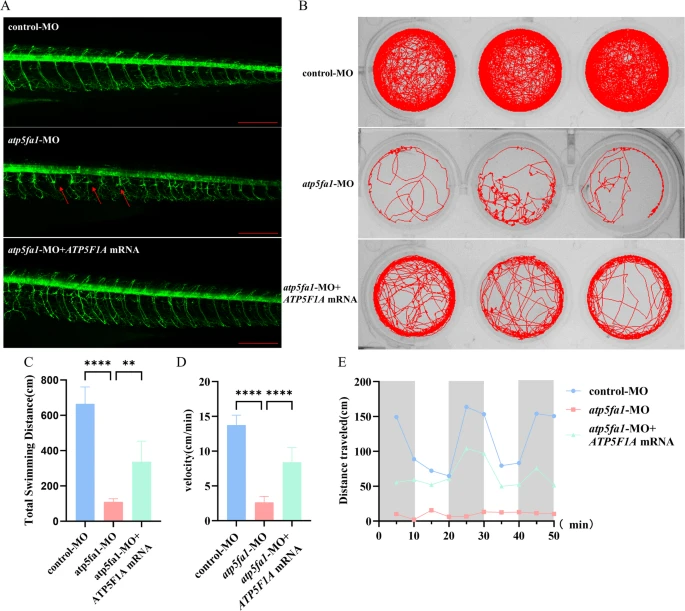
Fig. 5 Effects of Atp5fa1 reduction on zebrafish motor function. A Representative images of peripheral neurons in transgenic (mnx1:mGFP) zebrafish at 72hpf. Scale bar, 200 μm. B Movement trajectories of 120hpf zebrafish larvae in the control group (control-MO), atp5fa1 knockdown group (atp5fa1-MO), atp5fa1-MO and ATP5F1A mRNA co-injection group (n = 8 embryos/group). The lines indicate movement trajectories. C Quantification analysis of total swimming distance. (Mean ± SD, n = 8 embryos/group; ****P < 0.0001, Student t-test). D Quantification analysis of velocity. (Mean ± SD, n = 8 embryos/group; ****P < 0.0001, Student t-test). E Curves showing changes in swimming distance over time for zebrafish larvae in the control group, atp5fa1-MO group and atp5fa1-MO group + ATP5F1A mRNA during the light-dark alternation experiment. Swimming distance represents cumulative distance recorded every 5 min.