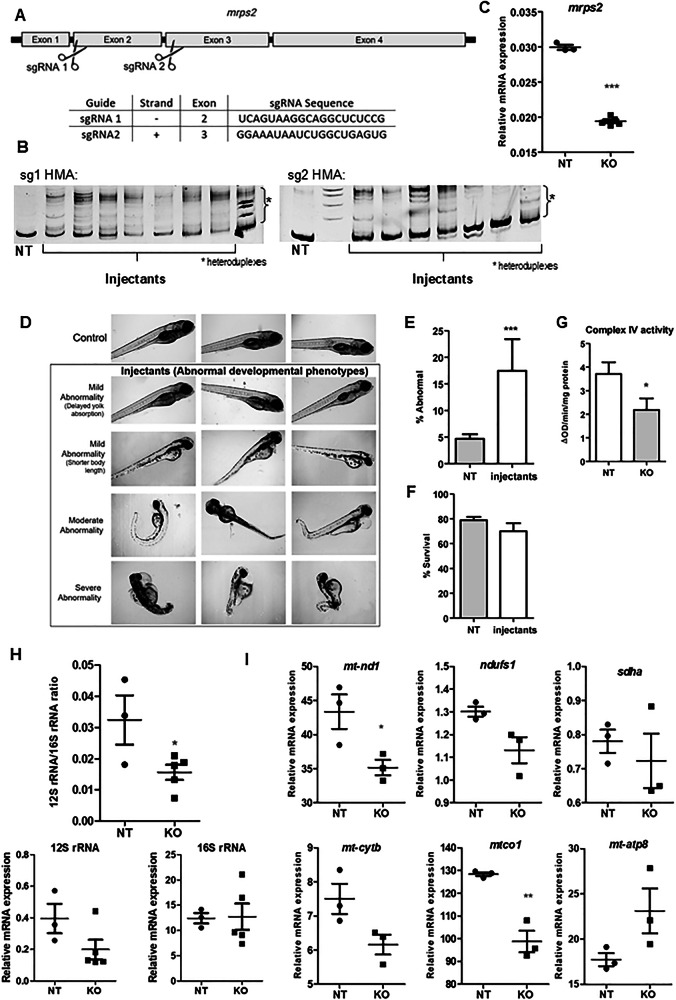
Image
Figure Caption

Fig. 4 Phenotypes in the mrps2 knockout zebrafish larvae.

A A schematic of the zebrafish mrps2 with the location of the selected sgRNA target sites indicated. The sequences of the two sgRNAs used in the study are provided in the table, B Assessment of editing efficiency for each sgRNA at 24 h post injection, by a heteroduplex mobility assay (HMA), C Relative expression levels of the mrps2 mRNA in the controls and injectants (crispants), D Representative bright field images of wild-type and mrps2 crispants (at 3dpf) illustrating abnormal developmental phenotypes observed in the crispants, as labeled, E, F Quantification of the number of larvae showing abnormal development at 5dpf (E) and survival at 7dpf (F) (5 experiments, NT n = 560, KO n = 820), G Complex IV activity measurement in mitochondria isolated from control and mrps2 crispants, H 12S to 16S rRNA ratio in the crispants compared to controls. Results from 3 to 5 independent experiments are quantified, and error bars represent SEM, (I) Relative mRNA levels of OXPHOS subunits genes including nd1, ndufs1 (Complex I), sdha (Complex II), cytb (Complex III), mt-co1 and mt-co2 (Complex IV), in the mrps2 crispants compared to controls.

Figure Data
Acknowledgments
This image is the copyrighted work of the attributed author or publisher, and ZFIN has permission only to display this image to its users. Additional permissions should be obtained from the applicable author or publisher of the image. Full text @ Eur. J. Hum. Genet.