FIGURE SUMMARY
Title

Further delineation of defects in MRPS2 causing human OXPHOS deficiency and early developmental abnormalities in zebrafish

Authors
Kandettu, A., Yeole, M., Sekar, H., Garapati, K., Kaur, N., Anand, A., Hegde, P., Nair, K., Medishetti, R., Bhat, V., Radhakrishnan, P., Mundkur, S.C., Shrikiran, H.A., Pandey, A., Sevilimedu, A., Chakrabarty, S., Shukla, A.
Source
Full text @ Eur. J. Hum. Genet.

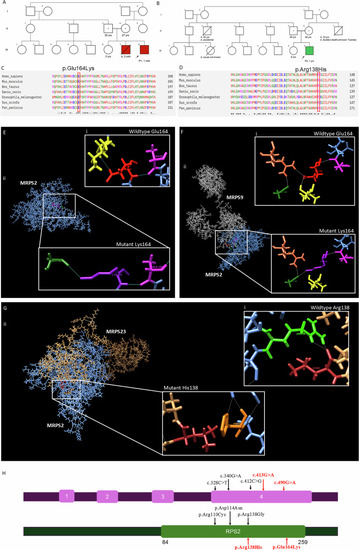
Details of family history and variants in MRPS2.

Pedigree of (A) Family 1 and (B) Family 2. Multiple sequence alignment shows (C) amino acid glutamine at 164 position and (D) arginine at 138 position is evolutionary conserved among Homo sapiens, Mus musculus, Bos taurus, Danio rerio, Drosophila melanogaster, Sus scrofa and Pan paniscus. E In silico protein modelling in MRPS2 protein structure shows (i) polar contacts (blue lines) of wild type Glu164 residue (red) with Ile142 (yellow) and Ala159 (pink) and in silico mutagenesis revealed that (ii) mutant Lys164 residue (purple) lost polar contact with Ile142 instead formed polar contact with Gly140 (dark green). F In silico protein modelling of MRPS2 and MRPS9 protein structures shows (i) wild type Glu164 residue (red) forms polar contacts (white lines) with Arg145 residue (coral) of MRPS9 and in silico mutagenesis revealed (ii) absence of polar contacts between mutant Lys164 residue (purple) of MRPS2 and any other residue of MRPS9. G In silico protein modelling of MRPS2 and MRPS23 protein structures shows (i) wild type Arg138 residue (light green) forms polar contacts (white lines) with Leu30 residue (brown) of MRPS23 and in silico mutagenesis revealed (ii) absence of polar contacts between mutant His138 (orange) of MRPS2 and any other residue of MRPS23. H Schematic representation of MRPS2 (NM_016034.5) and protein showing our variants (highlighted in red) and previously reported variants. RPS2:Ribosomal protein S2.

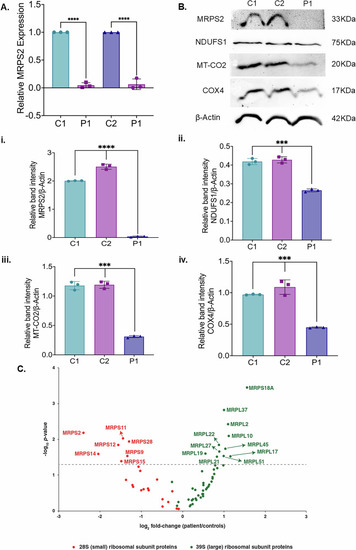
Analysis of MRPS2 expression and OXPHOS proteins in controls and P1 patient derived cells.

A qRT-PCR analysis showing relative MRPS2 mRNA expression in control 1 (C1), control 2 (C2) and patient (P1) cell lines. Expression of MRPS2 in P1 was significantly upregulated when compared to C1 and C2. β-Actin was used as the internal control; B Representative blot images for protein expression of MRPS2, NDUFS1, MT-CO2 and COX4; (i-iv) Western blot analysis of protein expression of MRPS2, NDUFS1, MT-CO2 and COX4 in C1, C2 and P1 fibroblast cell lines. Densitometric analysis was performed upon normalization of MRPS2, NDUFS1, MT-CO2 and COX4 protein band intensity to respective β-Actin band. *p < 0.05, **p < 0.01, ***p < 0.001 and ****p < 0.0001; C Altered abundance of mitochondrial ribosomal proteins. A volcano plot showing alterations in the levels of various mitochondrial ribosomal subunit proteins. Small and large mitochondrial ribosomal subunit proteins are represented by red and green dots, respectively, as indicated. The horizontal dashed line corresponds to p = 0.05.

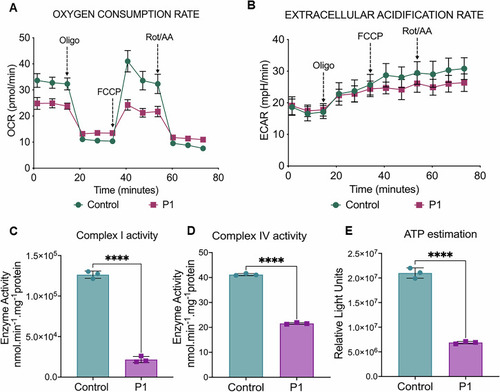
Analysis of mitochondrial OCR and EACR in control and patient fibroblast cells.
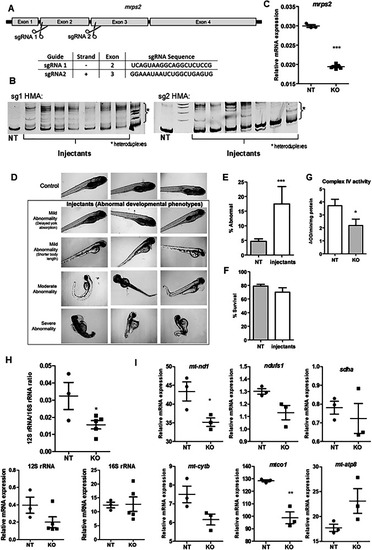
A Representative graph showing the OCR in control and P1 fibroblast cell lines. Injection of oligomycin, FCCP, and antimycin A and rotenone (A/R) are indicated (B) Representative graph showing the EACR in control and P1 cell lines. Injection of oligomycin, FCCP, and antimycin A and rotenone (A/R) are indicated (C) Mitochondrial complex I enzymatic activities in MRPS2 control and P1 cell lines (D) Mitochondrial complex IV enzymatic activities in control and P1 cell lines (E) Representative graph showing intracellular ATP levels. ATP determination kit was used to quantify intracellular ATP levels. *p < 0.05, **p < 0.001, ***p < 0.0001 and ****p < 0.00001.

Phenotypes in the mrps2 knockout zebrafish larvae.

A A schematic of the zebrafish mrps2 with the location of the selected sgRNA target sites indicated. The sequences of the two sgRNAs used in the study are provided in the table, B Assessment of editing efficiency for each sgRNA at 24 h post injection, by a heteroduplex mobility assay (HMA), C Relative expression levels of the mrps2 mRNA in the controls and injectants (crispants), D Representative bright field images of wild-type and mrps2 crispants (at 3dpf) illustrating abnormal developmental phenotypes observed in the crispants, as labeled, E, F Quantification of the number of larvae showing abnormal development at 5dpf (E) and survival at 7dpf (F) (5 experiments, NT n = 560, KO n = 820), G Complex IV activity measurement in mitochondria isolated from control and mrps2 crispants, H 12S to 16S rRNA ratio in the crispants compared to controls. Results from 3 to 5 independent experiments are quantified, and error bars represent SEM, (I) Relative mRNA levels of OXPHOS subunits genes including nd1, ndufs1 (Complex I), sdha (Complex II), cytb (Complex III), mt-co1 and mt-co2 (Complex IV), in the mrps2 crispants compared to controls.

Acknowledgments
This image is the copyrighted work of the attributed author or publisher, and ZFIN has permission only to display this image to its users. Additional permissions should be obtained from the applicable author or publisher of the image. Full text @ Eur. J. Hum. Genet.