FIGURE

Fig. 3

ID
ZDB-FIG-251105-40
Publication
Kandettu et al., 2025 - Further delineation of defects in MRPS2 causing human OXPHOS deficiency and early developmental abnormalities in zebrafish
Other Figures
All Figure Page
Back to All Figure Page
Fig. 3

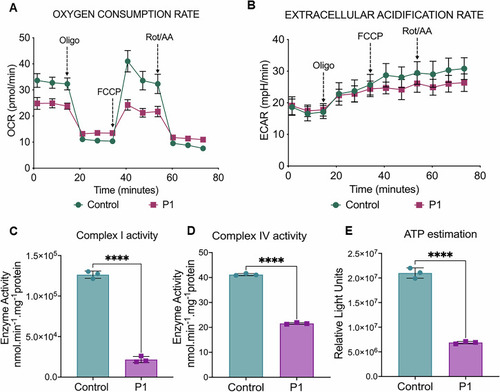
Analysis of mitochondrial OCR and EACR in control and patient fibroblast cells.

A Representative graph showing the OCR in control and P1 fibroblast cell lines. Injection of oligomycin, FCCP, and antimycin A and rotenone (A/R) are indicated (B) Representative graph showing the EACR in control and P1 cell lines. Injection of oligomycin, FCCP, and antimycin A and rotenone (A/R) are indicated (C) Mitochondrial complex I enzymatic activities in MRPS2 control and P1 cell lines (D) Mitochondrial complex IV enzymatic activities in control and P1 cell lines (E) Representative graph showing intracellular ATP levels. ATP determination kit was used to quantify intracellular ATP levels. *p < 0.05, **p < 0.001, ***p < 0.0001 and ****p < 0.00001.

Expression Data

Expression Detail
Antibody Labeling
Phenotype Data

Phenotype Detail
Acknowledgments
This image is the copyrighted work of the attributed author or publisher, and ZFIN has permission only to display this image to its users. Additional permissions should be obtained from the applicable author or publisher of the image. Full text @ Eur. J. Hum. Genet.