IMAGE

FIGURE 2

ID
ZDB-IMAGE-251121-5
Source
Figures for Heins-Marroquin et al., 2025
Image
Figure Caption

FIGURE 2

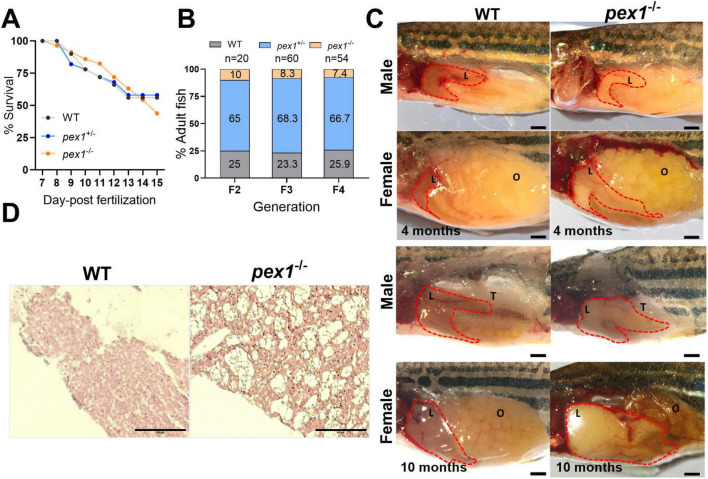
Survival and phenotypic characterization of the pex1 mutant zebrafish line. (A) Survival curves up to 15 days post-fertilization (dpf) (n = 50). (B) Percentage of wild-type (WT), heterozygous (pex1+/–), and homozygous (pex1–/–) mutant offspring reaching adulthood from F2 to F4 generations. (C) For organ morphology characterization, ten and five animals per genotype were dissected at 4 and 10 months, respectively. Representative post-mortem images of WT and pex1–/– female and male fish showing hepatic steatosis already at 4 months. Example of degenerated ovaries [O] and enlarged fatty liver in a 10-month-old female. Testis are indicated by a [T] in 10-month-old males. (D) H&E staining of liver sections from 7-month-old female fish revealed vacuolization in pex1–/– samples (the images are representative of 2 biological replicates). Scale bars represent 100 μm in (C,D).

Figure Data
Acknowledgments
This image is the copyrighted work of the attributed author or publisher, and ZFIN has permission only to display this image to its users. Additional permissions should be obtained from the applicable author or publisher of the image. Full text @ Front. Mol. Neurosci.