
|
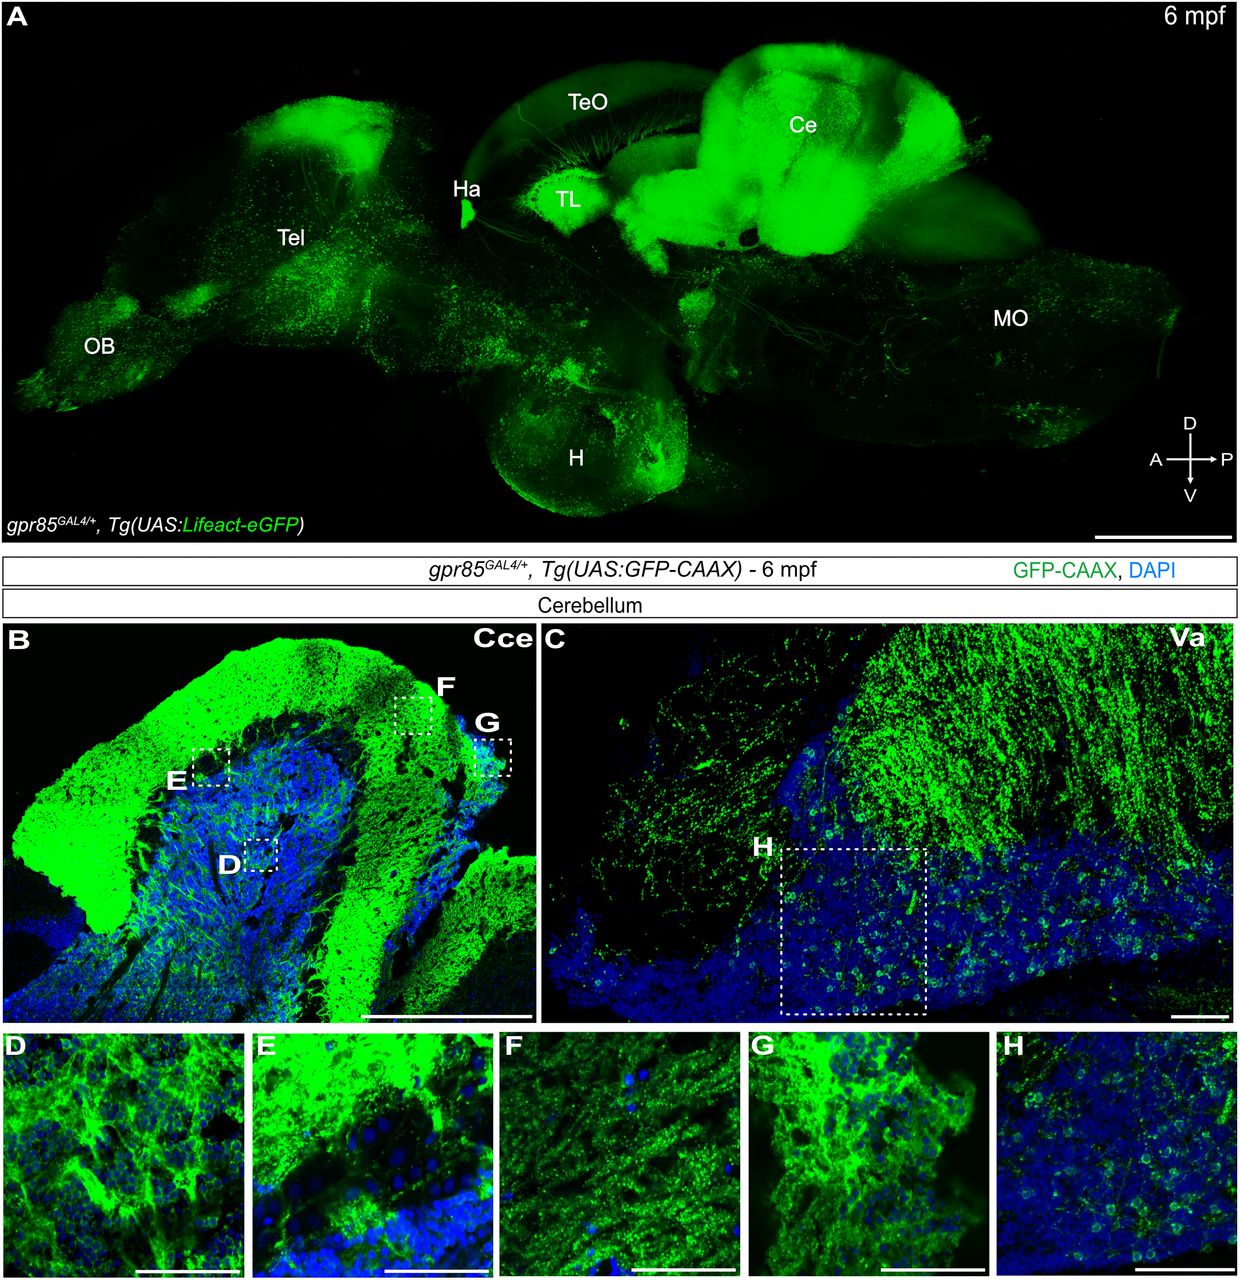
Fig. 2 Cartography of gpr85 expression in the brain of adult zebrafish. A, Maximum projection confocal images of native Lifeact-eGFP fluorescence in a cleared adult brain hemisphere (sagittal view) from a gpr85GAL4/+, Tg(UAS:Lifeact-eGFP) fish. Scale bar, 500 µm. B–H, Maximum projection confocal images of brain sections from a gpr85GAL4/+, Tg(UAS:GFP-CAAX) adult zebrafish stained with anti-GFP (green) and DAPI (blue). B, Sagittal sections of corpus cerebelli (Cce). The boxes indicate the boxes in A indicate the regions enlarged in panels D–G. C, Sagittal sections of valvula cerebelli (Va). The box in C indicates the region enlarged in panel H. D, GCL. E, PCL. F, Molecular layer. G, Lca. H, valvula cerebelli. (N = 3) Scale bars, (C, D, E, F, G, H) 50 µm, (B) 500 µm.