
- Title
-
Synaptic Gpr85 influences cerebellar granule cells electrical properties and light-induced behavior in zebrafish
- Authors
- Darche-Gabinaud, R., Kaafarani, A., Chazalon, M., Suain, V., Hendrickx, E., Conrard, L., Lefort, A., Libert, F., Demirler, M.C., Schiffmann, S.N., Perez-Morga, D., Wittamer, V., Parmentier, M., Pirson, I.
- Source
- Full text @ J. Neurosci.
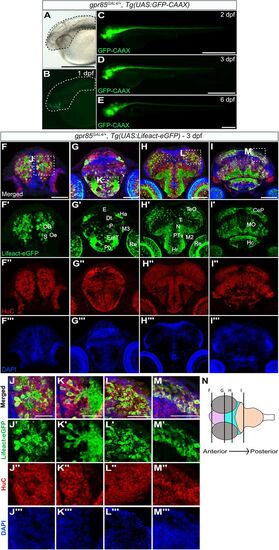
Gpr85 is broadly expressed by maturing neurons in the zebrafish brain parenchyma during late embryogenesis. A–E, Lateral views of live gpr85GAL4/+, Tg(UAS:GFP-CAAX) zebrafish embryos at 1 dpf with bright-field (A) and fluorescence imaging (B–E) showing the GFP-CAAX signal in the brain and spinal cord at 1 dpf (B), 2 dpf (C), 3 dpf (D), and 6 dpf (E). (N = 3) Scale bars, 50 μm. F–I, Maximum projection confocal images of coronal sections of the brain from a 3 dpf gpr85GAL4/+, Tg(UAS:Lifeact-eGFP) zebrafish larva stained with anti-GFP (green; F′–I′), anti-HuC (red; (F″–I″) and DAPI (blue; F″′–I″′). Lifeact-eGFP+ cells are observed in the OB, subpallium (F′), Ha, retina, eminentia thalami, preoptic region, pallium (G′), tectum opticum, hypothalamus (H′), cerebellar plate, and MO (I′). Boxed regions are enlarged in panels J to M. Scale bars, 50 µm. J–M, Enlarged optical sections of the areas boxed in panels (F–I), showing Lifeact-eGFP+/HuC+ neurons in the brain parenchyma. (N = 3) Scale bars, 25 µm. N, Schematic representation of the coronal sections of the brain illustrated in F–I, with the forebrain in pink, the midbrain in turquoise, and the hindbrain in peach. CeP, cerebellar plate; DT, dorsal thalamus; EmT, eminentia thalami; H, rostral hypothalamus; Ha, habenula; Hc, caudal hypothalamus; MO, medulla oblongata; N, region of the nucleus of medial longitudinal fascicle; M2, migrated posterior tubercular area; M3, migrated area of EmT; OB, olfactory bulb; Oe, olfactory epithelium; P, pallium, Po, preoptic region; PTv, ventral part of posterior tuberculum; Re, retina; S, subpallium; TeO, tectum opticum; T, midbrain tegmentum; dpf, days postfertilization. |
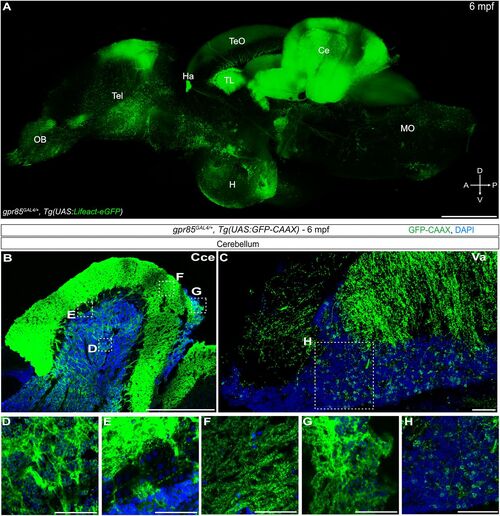
Cartography of gpr85 expression in the brain of adult zebrafish. A, Maximum projection confocal images of native Lifeact-eGFP fluorescence in a cleared adult brain hemisphere (sagittal view) from a gpr85GAL4/+, Tg(UAS:Lifeact-eGFP) fish. Scale bar, 500 µm. B–H, Maximum projection confocal images of brain sections from a gpr85GAL4/+, Tg(UAS:GFP-CAAX) adult zebrafish stained with anti-GFP (green) and DAPI (blue). B, Sagittal sections of corpus cerebelli (Cce). The boxes indicate the boxes in A indicate the regions enlarged in panels D–G. C, Sagittal sections of valvula cerebelli (Va). The box in C indicates the region enlarged in panel H. D, GCL. E, PCL. F, Molecular layer. G, Lca. H, valvula cerebelli. (N = 3) Scale bars, (C, D, E, F, G, H) 50 µm, (B) 500 µm. |
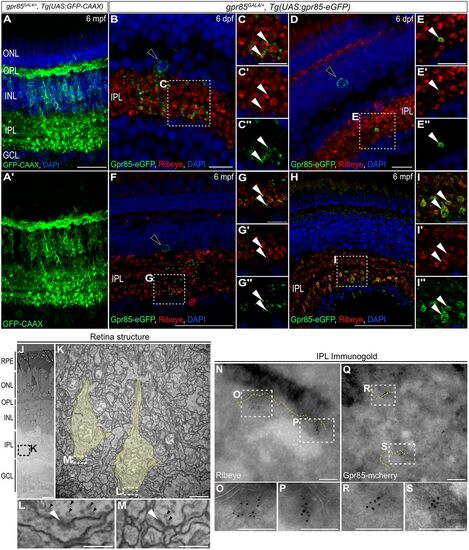
Gpr85 is enriched in the pre- and postsynaptic compartments of developing and adult IPL retinal ribbon synapses. A, Maximum projection confocal images of the retina from a gpr85GAL4/+, Tg(UAS:GFP-CAAX) adult zebrafish stained with anti-GFP (green) and DAPI (blue). (N = 3) Scale bar, 50 µm. B–I, Confocal images of coronal retinal sections from 6 dpf (B–E″) or 6 mpf (F–I″) gpr85GAL4/+, Tg(UAS:gpr85-eGFP) zebrafish stained with anti-GFP (green), anti-Ribeye-A (red), and DAPI (blue). B, F, Larval or adult Gpr85-eGFP+ AC somas and signal within the IPL are shown, with boxed regions enlarged in C-C″ and G-G″, respectively. White arrowheads highlight Gpr85-eGFP signals adjacent to Ribeye+ ribbon terminals. D, H, Larval or adult Gpr85-eGFP+/Ribeye-A+ BPC ribbon presynaptic terminals are shown, with boxed regions enlarged in E-E″ and I-I″, respectively. White arrowheads show examples of Gpr85-eGFP signal present in Ribeye+ ribbon terminals. (N = 3) Scale bars, (B, D) 25 µm, (F, H) 50 µm, (C, E, G, I) 10 µm. J, Electron microscopy coronal view of the structure of 6 dpf retina from gpr85GAL4/+, Tg(UAS:gpr85-mCherry) zebrafish larvae. (N = 3) Scale bar, 10 µm. K, Enlarged image of the ribbon presynaptic terminals (yellow) from the boxed area in panel J. Scale bar, 1 µm. L, M, Enlarged images of synaptic boutons from the boxed area in panel K. White arrowheads highlight postsynaptic densities while black arrowheads point to presynaptic vesicles. Scale bars, 200 nm. N–S, Immunogold labeling of Ribeye (N–P) and mCherry-tagged Gpr85 (Q–S) focusing on the retinal inner plexiform layer from 6 dpf gpr85GAL4/+, Tg(UAS:gpr85-mCherry) larvae. Dashed yellow lines highlight plasma membranes. Boxes indicate regions enlarged in panels O, P, R, and S. Scale bars, 200 nm. dpf, days postfertilization; mpf, months postfertilization; ONL, outer nuclear layer; OPL, outer plexiform layer; INL, inner nuclear layer; GCL ganglion cell layer. |
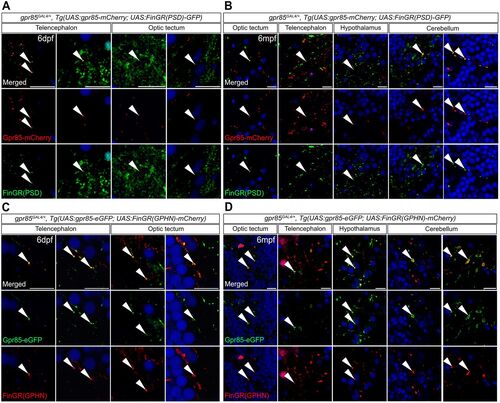
Gpr85 is enriched at the level of excitatory and inhibitory synaptic inputs of gpr85-expressing neurons throughout the developing and adult brain. A, Confocal images of coronal brain sections from 6 dpf gpr85GAL4/+, Tg(UAS:gpr85-mCherry; UAS:FinGR(PSD)-GFP) larvae stained with anti-GFP (green), anti-mCherry (red), and DAPI (blue). White arrowheads show examples of Gpr85-mCherry signal localized at the level of PSD+ excitatory synapses in the Tel and TeO. Scale bar, 10 µm. B, Confocal images of coronal brain sections from 6 mpf gpr85GAL4/+, Tg(UAS:gpr85-mCherry; UAS:FinGR(PSD)-GFP) adult zebrafish stained with anti-GFP (green), anti-mCherry (red), and DAPI (blue). White arrowheads show examples of Gpr85-mCherry signal localized at the level of PSD+ excitatory synapses in the indicated brain regions. Scale bar, 10 µm. C, Confocal images of coronal brain sections from 6 dpf gpr85GAL4/+, Tg(UAS:gpr85-eGFP; UAS:FinGR(GPHN)-mCherry) larvae stained with anti-GFP (green), anti-mCherry (red), and DAPI (blue). White arrowheads highlight examples of Gpr85-eGFP signal present at the level of the GPHN+ inhibitory synapses in the Tel and TeO. Scale bar, 10 µm. D, Confocal images of coronal brain sections from 6 mpf gpr85GAL4/+, Tg(UAS:gpr85-eGFP; UAS:FinGR(GPHN)-mCherry) adult zebrafish stained with anti-GFP (green), anti-mCherry (red), and DAPI (blue). White arrowheads highlight examples of Gpr85-eGFP signal present at the level of the GPHN+ inhibitory synapses of the indicated brain regions. Scale bar, 10 µm. (for all N = 3) dpf, days postfertilization; mpf, months postfertilization. GPHN, Gephyrin; PSD, postsynaptic density protein 95. |
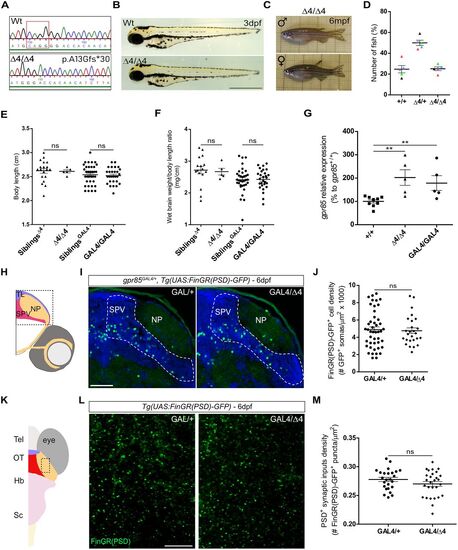
Zebrafish gpr85 loss-of-function models are phenotypically normal, and cell and excitatory synaptic input densities of Gpr85-deficient neurons are unaffected through development. A, Genomic sequence of WT and gpr85 deletion mutant (Δ4/Δ4) zebrafish. The mutant gpr85 sequence, generated via CRISPR/Cas9, results in a 4 base pair deletion (boxed) in exon 2, introducing a premature stop codon 17 amino acids later (p.Ala13Glyfs*30). B, No phenotypic differences were observed between 3 dpf WT or Δ4/Δ4 larvae. Scale bar, 500 µm. C, Adult gpr85Δ4/Δ4 zebrafish show no macroscopic defects. D, Genotypic analysis of adult fish from heterozygous intercrosses. A normal Mendelian inheritance ratio is observed. Each dot color represents an independent cross (n = 5; at least 25 fish genotyped per cross; means: +/+, 24.7%; +/Δ4, 50%; Δ4/Δ4, 25.3%). E, Body length measurements of adult zebrafish with gpr85Δ4/Δ4 (n = 5) and gpr85GAL4/GAL4 (n = 28) loss-of-function mutations, compared with their respective control siblings (n = 18 for Δ4 siblings; n = 37 for GAL4 siblings). Statistical analysis, +/+ vs Δ4/Δ4, ns, p = 0,68; GAL4/+ vs GAL4/GAL4, ns, p = 0.59; M–W test. F, Wet brain weight normalized to body length for adult zebrafish with gpr85Δ4/Δ4 and gpr85GAL4/GAL4 loss-of-function mutations, compared with their respective control siblings (+/+ vs Δ4/Δ4, ns, p = 0.41; GAL4/+ vs GAL4/GAL4, ns, p = 0.91; M–W test). G, gpr85 transcript levels measured by RT-QPCR in gpr85+/+ (n = 9), gpr85Δ4/Δ4 (n = 5) and gpr85GAL4/GAL4 (n = 5) 6 dpf larvae (+/+ vs Δ4/Δ4, **p = 0.002; +/+ vs GAL4/GAL4, **p = 0.007; M–W test). H, Schematic coronal view of a 6 dpf zebrafish larva brain. The box indicates the TeO region imaged in I. I, Maximum projection confocal images of TeO coronal sections from 6 dpf gpr85GAL4/+, Tg(UAS:FinGR(PSD)-GFP) larvae immunostained with anti-GFP (green) and DAPI (blue). (N = 3) Scale bar, 50 µm. J, Quantification of PSD+ gpr85-expressing neuronal soma in the TeO SPV at 6 dpf. gpr85GAL4/+ controls (n = 45) are compared with gpr85GAL4/Δ4 fish (n = 26; gpr85GAL4/+ vs gpr85GAL4/Δ4; ns, not significant; p = 0.8; unpaired t test). K, Schematic dorsal view of a 6 dpf zebrafish larva brain. The box indicates the NP regions imaged in L. L, Live confocal imaging of the NP area from a 6 dpf gpr85GAL4/+ vs gpr85GAL4/Δ4, Tg(UAS:FinGR(PSD)-GFP) larva (dorsal view) showing PSD+ excitatory synapses from gpr85-expressing neurons. Scale bars, 10 µm. M, Quantification of PSD+ excitatory synapses belonging to gpr85-expressing neurons in the TeO NP at 6 dpf. gpr85GAL4/+ controls (n = 25) are compared with gpr85GAL4/GAL4 fish, as gpr85-deficient model (n = 28; gpr85GAL4/+ vs gpr85GAL4/Δ4; ns, not significant, p = 0.169; unpaired t test). SPV, stratum paraventriculare; NP, neuropil. Data are presented as mean ± SEM. |
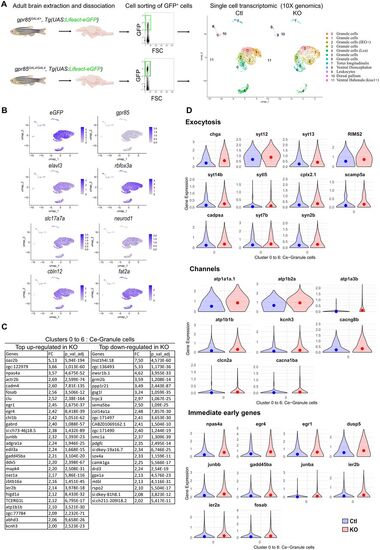
scRNAseq analysis of eGFP+ sorted cells from adult gpr85GAL4/+ and gpr85GAL4/GAL4, Tg(UAS:lifeact-eGFP) dissociated brains reveals changes in gene expression related to neuronal activity. A, Experimental strategy for assessing transcriptomic changes in gpr85-expressing cells from the Gpr85-deficient adult brain. GFP+ cells were sorted from gpr85GAL4/+ (Ctl) and gpr85GAL4/GAL4 (KO), Tg(UAS:lifeact-eGFP) dissociated brains (cell sorting strategy shown with 10,000 events per condition). The right panel shows the UMAPs of cells from the Ctl and KO conditions (n = 4,219 cells and n = 3,341 cells, respectively) after filtering and clustering. B, UMAPs of Ctl and KO cells merged, displaying expression of the UAS:lifeact-eGFP transgene, gpr85, the two pan-neuronal markers elavl3 and rbfox3a, as well as the expression of the GC markers, sls17s7a, neurod1, cbln12, and fat2a. C, Table of the most up- and downregulated genes within the isolated cerebellar clusters (0 to 6) in the KO condition, with a minimal FC of two and an adjusted p < 10−4, expressed by at least 6% of the cells. D, Violin plots of most significantly DEGs with a minimal FC of 1.4 and an adjusted p < 10−4. All genes referenced are upregulated (mean represented by the dots). Top panel, Selection of genes related to exocytosis. Intermediate panel, Selection of genes encoding channels related to neuronal excitability/activity (voltage-dependent channels, clcn2a, cacna1ba, kcnh3, cacng8b; Na+/K+ ATPase subunits, atp1a3b, atp1b1b, atp1a1a.1, atp1b2a, syn2b). Lower panel, genes documented as IEGs. |
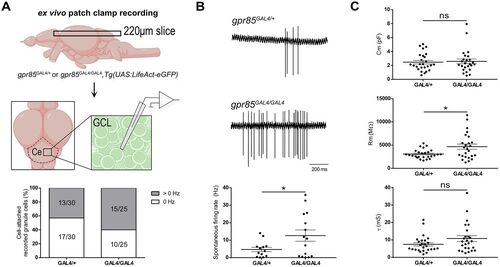
Gpr85-KO impacts adult cerebellar GCs electrophysiological properties. A, Schematic representation of the experimental setup. Cerebellar horizontal sections (220 µm) were prepared, and GCs were identified based on GFP fluorescence. Recordings were made in cell-attached and whole-cell voltage–clamp configurations. The chart illustrates the percentage of GCs in cell-attached configuration that exhibited or not spontaneous activity. B, Quantification of GCs spontaneous activity in a cell-attached configuration. Firing patterns are shown, as well as the firing rates measured over a 60 s recording (gpr85GAL4/+, n = 13, vs gpr85GAL4/GAL4, n = 15; *p = 0.0347; unpaired t test with Welch's correction). C, Quantification of GCs passive properties (membrane capacitance, Cm; membrane resistance, Rm; membrane time constant, τ) in a whole-cell voltage–clamp configuration (gpr85GAL4/+, n = 26, vs gpr85GAL4/GAL4, n = 25; Cm, ns, p = 0.9132; τ, ns, p = 0.1724; M–W U tests; Rm, *p = 0.0113; unpaired t test with Welch's correction). Ce, cerebellum; GCL, granule cell layer. Data are presented as mean ± SEM (B, C). |
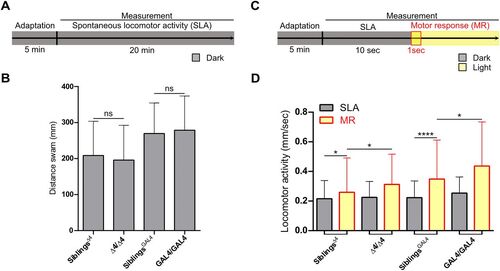
Gpr85-KO impacts larval light-induced motor response. A, Schematic representation of the experimental setup for assessing spontaneous locomotor activity. B, Quantification of the distance swum by 6 dpf Gpr85-KO larvae compared with siblings over 20 min in the dark (gpr85Δ4/Δ4, n = 69 vs siblings, n = 210; p = 0.36; and gpr85GAL4/GAL4, n = 77, vs siblings, n = 190; p = 0.94; ns, not significant; M–W U tests). C, Schematic representation of the experimental setup for measuring light-induced motor responses. The motor response was recorded within the first second following light onset. D, The motor response was observed in controls as a significant increase in the distance swum following light onset (n = 210 siblings of gpr85Δ4/Δ4 mutants; dark vs motor response; *p = 0.02; n = 247 siblings of gpr85GAL4/GAL4 mutants, dark vs motor response; ****p < 0.0001; Wilcoxon matched-paired signed–rank tests). The motor response was significantly more pronounced in gpr85-deficient animals compared with controls (n = 80 gpr85Δ4/Δ4 mutants vs siblings; *p = 0.015; n = 83 gpr85GAL4/GAL4 mutants vs siblings, *p = 0.011; M–W U tests). SLA, spontaneous locomotor activity; SR, motor response. Data are presented as mean ± SD (B, D). |