
Fig. 5
- ID
- ZDB-FIG-251230-32
- Publication
- Darche-Gabinaud et al., 2025 - Synaptic Gpr85 influences cerebellar granule cells electrical properties and light-induced behavior in zebrafish
- Other Figures
- All Figure Page
- Back to All Figure Page
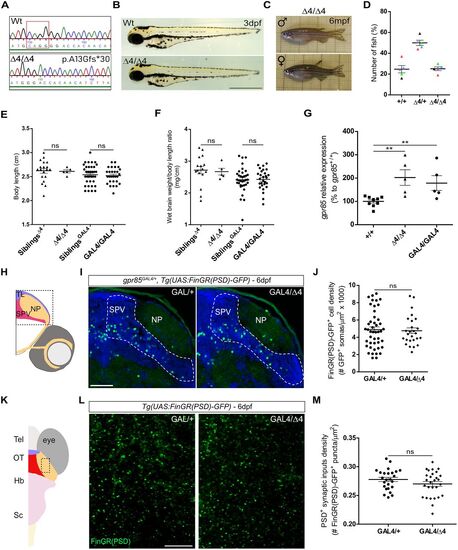
Zebrafish gpr85 loss-of-function models are phenotypically normal, and cell and excitatory synaptic input densities of Gpr85-deficient neurons are unaffected through development. A, Genomic sequence of WT and gpr85 deletion mutant (Δ4/Δ4) zebrafish. The mutant gpr85 sequence, generated via CRISPR/Cas9, results in a 4 base pair deletion (boxed) in exon 2, introducing a premature stop codon 17 amino acids later (p.Ala13Glyfs*30). B, No phenotypic differences were observed between 3 dpf WT or Δ4/Δ4 larvae. Scale bar, 500 µm. C, Adult gpr85Δ4/Δ4 zebrafish show no macroscopic defects. D, Genotypic analysis of adult fish from heterozygous intercrosses. A normal Mendelian inheritance ratio is observed. Each dot color represents an independent cross (n = 5; at least 25 fish genotyped per cross; means: +/+, 24.7%; +/Δ4, 50%; Δ4/Δ4, 25.3%). E, Body length measurements of adult zebrafish with gpr85Δ4/Δ4 (n = 5) and gpr85GAL4/GAL4 (n = 28) loss-of-function mutations, compared with their respective control siblings (n = 18 for Δ4 siblings; n = 37 for GAL4 siblings). Statistical analysis, +/+ vs Δ4/Δ4, ns, p = 0,68; GAL4/+ vs GAL4/GAL4, ns, p = 0.59; M–W test. F, Wet brain weight normalized to body length for adult zebrafish with gpr85Δ4/Δ4 and gpr85GAL4/GAL4 loss-of-function mutations, compared with their respective control siblings (+/+ vs Δ4/Δ4, ns, p = 0.41; GAL4/+ vs GAL4/GAL4, ns, p = 0.91; M–W test). G, gpr85 transcript levels measured by RT-QPCR in gpr85+/+ (n = 9), gpr85Δ4/Δ4 (n = 5) and gpr85GAL4/GAL4 (n = 5) 6 dpf larvae (+/+ vs Δ4/Δ4, **p = 0.002; +/+ vs GAL4/GAL4, **p = 0.007; M–W test). H, Schematic coronal view of a 6 dpf zebrafish larva brain. The box indicates the TeO region imaged in I. I, Maximum projection confocal images of TeO coronal sections from 6 dpf gpr85GAL4/+, Tg(UAS:FinGR(PSD)-GFP) larvae immunostained with anti-GFP (green) and DAPI (blue). (N = 3) Scale bar, 50 µm. J, Quantification of PSD+ gpr85-expressing neuronal soma in the TeO SPV at 6 dpf. gpr85GAL4/+ controls (n = 45) are compared with gpr85GAL4/Δ4 fish (n = 26; gpr85GAL4/+ vs gpr85GAL4/Δ4; ns, not significant; p = 0.8; unpaired t test). K, Schematic dorsal view of a 6 dpf zebrafish larva brain. The box indicates the NP regions imaged in L. L, Live confocal imaging of the NP area from a 6 dpf gpr85GAL4/+ vs gpr85GAL4/Δ4, Tg(UAS:FinGR(PSD)-GFP) larva (dorsal view) showing PSD+ excitatory synapses from gpr85-expressing neurons. Scale bars, 10 µm. M, Quantification of PSD+ excitatory synapses belonging to gpr85-expressing neurons in the TeO NP at 6 dpf. gpr85GAL4/+ controls (n = 25) are compared with gpr85GAL4/GAL4 fish, as gpr85-deficient model (n = 28; gpr85GAL4/+ vs gpr85GAL4/Δ4; ns, not significant, p = 0.169; unpaired t test). SPV, stratum paraventriculare; NP, neuropil. Data are presented as mean ± SEM. |