
|
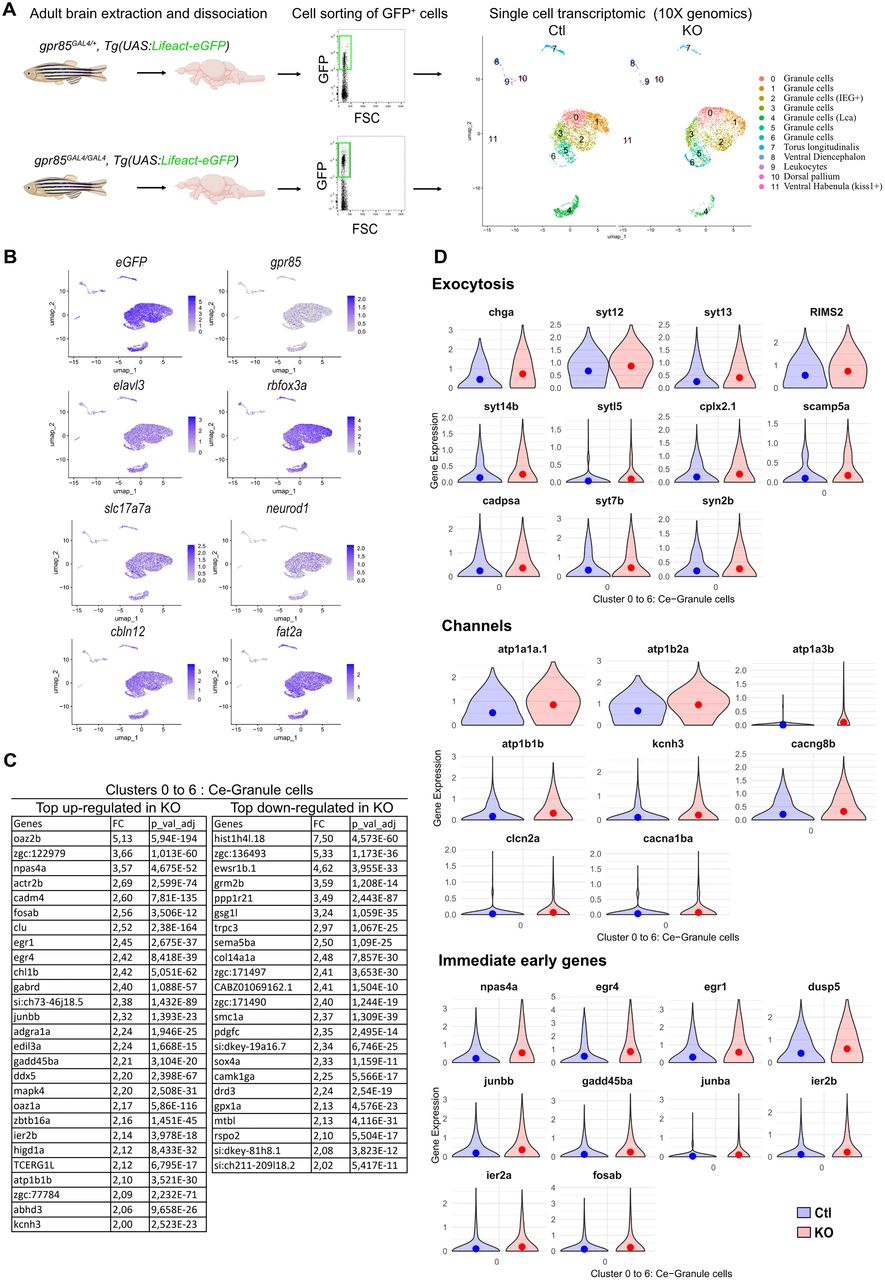
Fig. 6 scRNAseq analysis of eGFP+ sorted cells from adult gpr85GAL4/+ and gpr85GAL4/GAL4, Tg(UAS:lifeact-eGFP) dissociated brains reveals changes in gene expression related to neuronal activity. A, Experimental strategy for assessing transcriptomic changes in gpr85-expressing cells from the Gpr85-deficient adult brain. GFP+ cells were sorted from gpr85GAL4/+ (Ctl) and gpr85GAL4/GAL4 (KO), Tg(UAS:lifeact-eGFP) dissociated brains (cell sorting strategy shown with 10,000 events per condition). The right panel shows the UMAPs of cells from the Ctl and KO conditions (n = 4,219 cells and n = 3,341 cells, respectively) after filtering and clustering. B, UMAPs of Ctl and KO cells merged, displaying expression of the UAS:lifeact-eGFP transgene, gpr85, the two pan-neuronal markers elavl3 and rbfox3a, as well as the expression of the GC markers, sls17s7a, neurod1, cbln12, and fat2a. C, Table of the most up- and downregulated genes within the isolated cerebellar clusters (0 to 6) in the KO condition, with a minimal FC of two and an adjusted p < 10−4, expressed by at least 6% of the cells. D, Violin plots of most significantly DEGs with a minimal FC of 1.4 and an adjusted p < 10−4. All genes referenced are upregulated (mean represented by the dots). Top panel, Selection of genes related to exocytosis. Intermediate panel, Selection of genes encoding channels related to neuronal excitability/activity (voltage-dependent channels, clcn2a, cacna1ba, kcnh3, cacng8b; Na+/K+ ATPase subunits, atp1a3b, atp1b1b, atp1a1a.1, atp1b2a, syn2b). Lower panel, genes documented as IEGs.