IMAGE

Fig. 6

ID
ZDB-IMAGE-260416-68
Publication
Coppola et al., 2025 - Zebrafish as a model for Catel-Manzke syndrome-identification and characterization of the zebrafish TGDS ortholog
All Figures
Figures for Coppola et al., 2025
Image
Figure Caption

Fig. 6

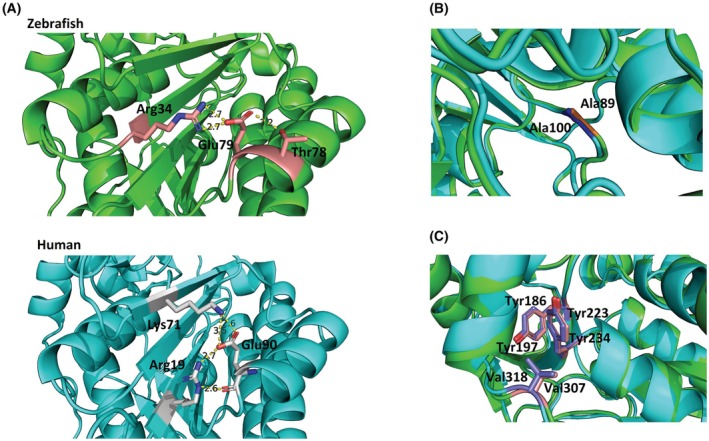
Structural models of zebrafish Tgds and human TGDS, highlighting regions affected by the analyzed amino acid substitutions. Closer views of these regions are shown, with zebrafish Tgds colored green and human TGDS colored cyan. The models were obtained from the AlphaFold database and aligned by PyMOL: zebrafish Tgds: UniProt Q6NYF5, AlphaFold AF‐Q6NYF5‐F1‐v4; human TGDS: UniProt O95455, AlphaFold AF‐O95455‐F1‐v4. (A) In zebrafish Tgds (upper panel), Glu79 forms polar interactions with Arg34 and Thr78. The corresponding residue in human TGDS (lower panel), Glu90, interacts with Arg19 and Lys71. (B) The structural alignment shows perfect superimposition of zebrafish Ala89 and human Ala100. (C) Zebrafish Tyr223 and human Tyr234 are superimposed and exhibit similar interactions with nearby residues.

Acknowledgments
This image is the copyrighted work of the attributed author or publisher, and ZFIN has permission only to display this image to its users. Additional permissions should be obtained from the applicable author or publisher of the image. Full text @ FEBS J.