
Fig. 6
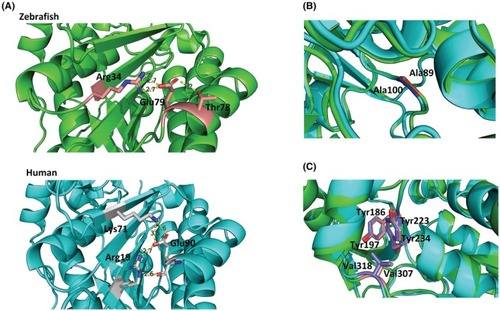
Structural models of zebrafish Tgds and human TGDS, highlighting regions affected by the analyzed amino acid substitutions. Closer views of these regions are shown, with zebrafish Tgds colored green and human TGDS colored cyan. The models were obtained from the AlphaFold database and aligned by PyMOL: zebrafish Tgds: UniProt |