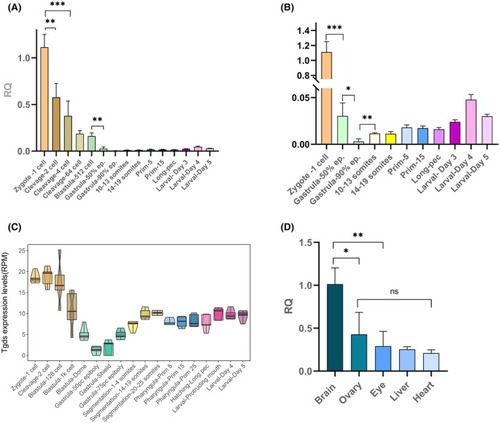
Expression of tgds transcripts in adult tissues and during zebrafish development. (A) The expression dynamics of tgds were examined during zebrafish development via RT–qPCR. cDNA was generated from samples collected at various developmental stages, and the 1‐cell stage was used as the reference point for normalization. (B) An enlarged view of panel A focuses on tgds expression levels in the more advanced stages of development. (C) To complement the targeted expression analysis, publicly available RNA‐seq data from a zebrafish development dataset [22] were analyzed by mapping reads to the tgds coding sequence. (D) RT–qPCR was employed to quantify the relative abundance of tgds in various adult tissues. The brain tissue served as the reference for normalization in this analysis. Statistical analysis revealed significant differences in tgds expression between the brain and other tissues. Welch's t‐test was used for the statistical analyses: mean ± SD, obtained from at least three independent replicates for each point is presented (*P < 0.05, **P < 0.01, ***P < 0.005, ns = not significant).
|
