
Figure 6.
- ID
- ZDB-IMAGE-260509-21
- Publication
- Gillotay et al., 2026 - The role of Nrf2 in thyroid maturation and hormone synthesis in vertebrate models
- All Figures
- Figures for Gillotay et al., 2026
|
Figure 6.
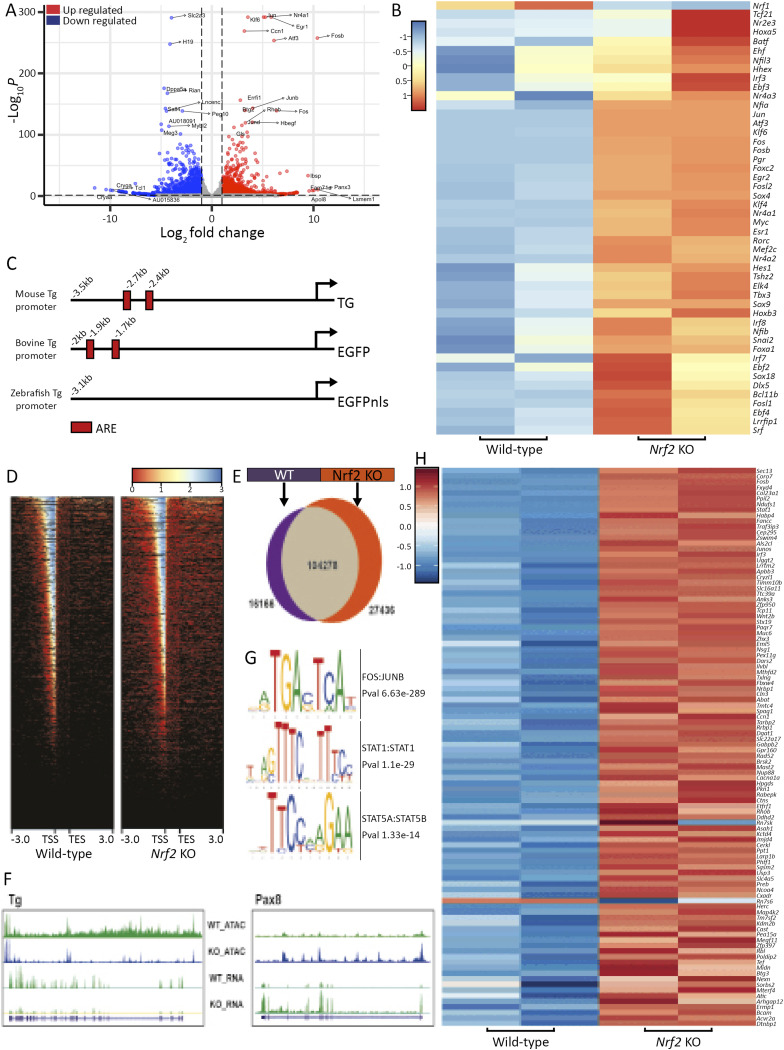
Transcriptomic and chromatin accessibility profile comparison between mESC-derived Nrf2 WT and KO organoids.
(A) Volcano plot showing the distribution of the down- and up-regulated genes among Nrf2−/− cells compared with the control condition (WT). (B) Heatmap of normalized bulk RNA-seq expression of up-regulated transcription factor in Nrf2 KO–derived thyrocytes. (C) Schematic representation of mouse, bovine, and zebrafish Tg promoter based on available sequence (mouse promoter) and sequences used as reporter drivers (bovine and zebrafish promoters). ARE sequences are represented as red boxes, and their relative position to the end of the promoters is given. (D) Heatmaps show profiling of chromatin accessibility around gene transcription start sites (TSS) in Nrf2 WT (left panel)– and KO (right panel)–derived organoids. (E) Venn diagram representing the differentially represented peak in Nrf2 WT (purple)– and Nrf2 KO (orange)–derived organoids. (F) RNA and ATACseq browser track of Tg (left panel) and Pax8 (right panel) showing reduced Tg and increased Pax8 mRNA levels. These differences in transcript levels correlated with differential chromatin accessibility peaks. (G) Transcription factor binding motif enrichment in Nrf2 KO–derived organoids. (H) Heatmap of normalized bulk RNA-seq expression displaying either FOS:JUNB or STAT54:STAT5B binding motifs in the 5 kb upstream of their TSS.