
- Title
-
Bisphenol A Exposure Induces Sensory Processing Deficits in Larval Zebrafish During Neurodevelopment
- Authors
- Scaramella, C., Alzagatiti, J.B., Creighton, C., Mankatala, S., Licea, F., Winter, G.M., Emtage, J., Wisnieski, J.R., Salazar, L., Hussain, A., Lee, F.M., Mammootty, A., Mammootty, N., Aldujaili, A., Runnberg, K.A., Hernandez, D., Zimmerman-Thompson, T., Makwana, R., Rouvere, J., Tahmasebi, Z., Zavradyan, G., Campbell, C.S., Komaranchath, M., Carmona, J., Trevitt, J., Glanzman, D., Roberts, A.C.
- Source
- Full text @ eNeuro

Image of a zebrafish larva illustrating the area used for head size measurements. Dorsal view of a zebrafish larvae embedded in low melting point agarose. Red lines outline the area measured to determine the head size of larvae. Scale bar: 150 μm. |
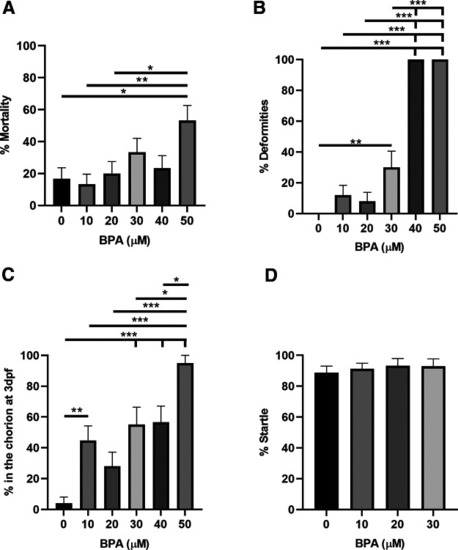
BPA exposure can increase mortality, deformity, and delays in hatching in zebrafish. PHENOTYPE:
|

Extended exposure to DMSO does not increase mortality, delays in hatching, or abnormal sensorimotor responses. |
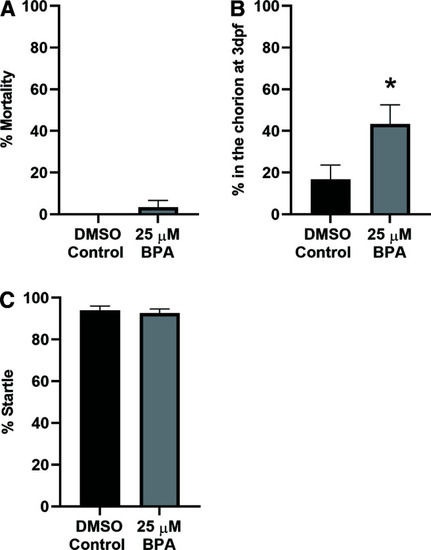
Exposure to 25 μ PHENOTYPE:
|
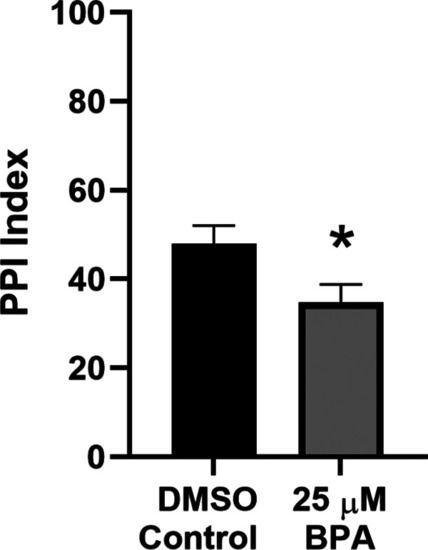
BPA exposure disrupts PPI in zebrafish larvae. Effect on PPI of exposure to 25 μ PHENOTYPE:
|
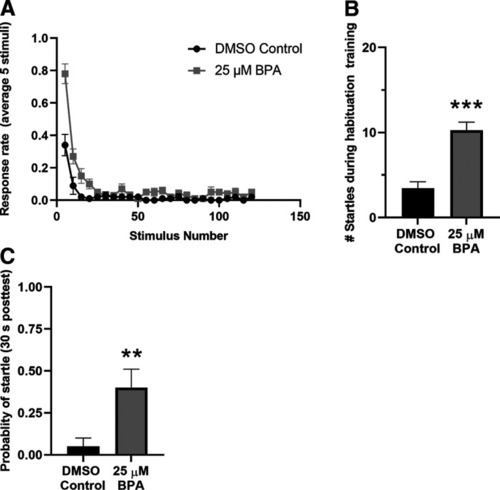
BPA exposure reduces STH. PHENOTYPE:
|
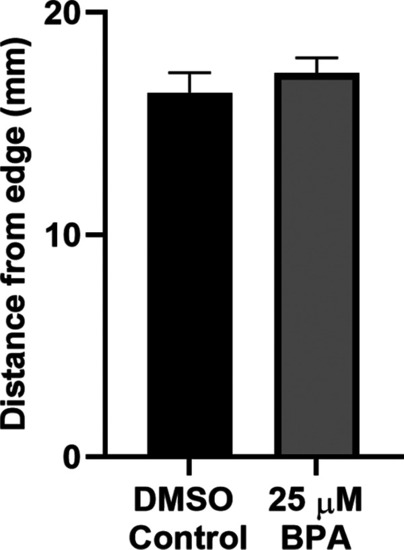
Thigmotaxis was not increased in zebrafish exposed to BPA. The mean distance from the edge of the experimental dish during swimming in the BPA-exposed group ( PHENOTYPE:
|
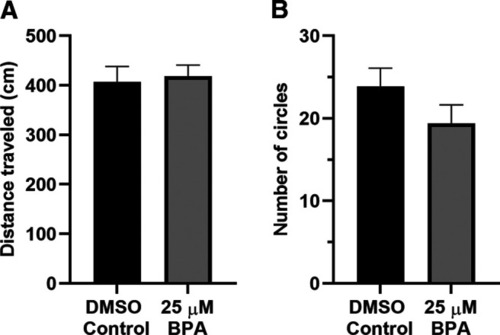
BPA exposure did not modify locomotion in zebrafish larvae. PHENOTYPE:
|
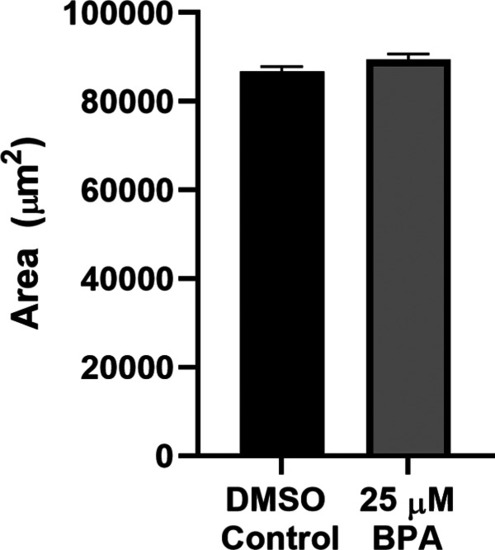
Exposure to BPA did not change head size in zebrafish larvae. Mean volume of the head in BPA-treated (BPA group, PHENOTYPE:
|

Brain volume was not changed in zebrafish larvae by BPA exposure. EXPRESSION / LABELING:
|