FIGURE SUMMARY
Title

flt1 inactivation promotes zebrafish cardiac regeneration by enhancing endothelial activity and limiting the fibrotic response

Authors
Wang, Z.Y., Mehra, A., Wang, Q.C., Gupta, S., Ribeiro da Silva, A., Juan, T., Günther, S., Looso, M., Detleffsen, J., Stainier, D.Y.R., Marín-Juez, R.
Source
Full text @ Development

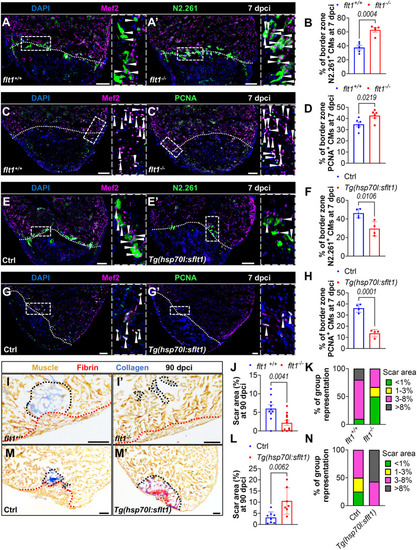
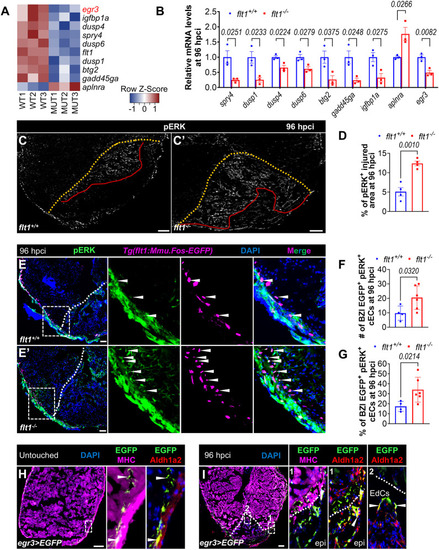
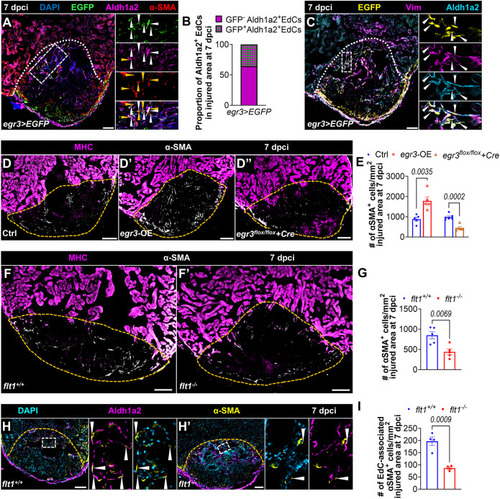
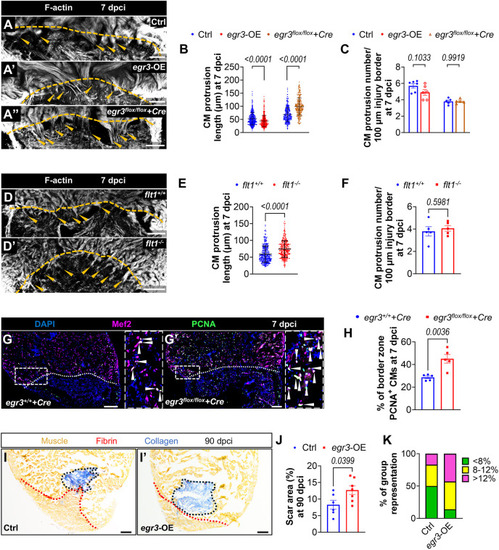
Flt1 regulates endothelial regeneration. (A-B″) Whole-mount images of cryoinjured ventricles from Tg(-0.8flt1:RFP);flt1+/+ (n=6, A) and Tg(-0.8flt1:RFP);flt1−/− (n=6, A′) zebrafish, and from Tg(-0.8flt1:RFP) (Ctrl, n=7, B) and Tg(-0.8flt1:RFP);Tg(hsp70l:sflt1) (n=7, B′) zebrafish showing revascularization of the injured area at 96 hpci (A,A′) and 7 dpci (B,B′), and the corresponding percentage of coronary coverage of the injured area (A″,B″). (C-D′) Whole-mount images of cryoinjured ventricles from Tg(-0.8flt1:RFP) (Ctrl, C,D) and Tg(-0.8flt1:RFP);Tg(hsp70l:sflt1) (C′,D′) zebrafish showing revascularization at 30 dpci (C,C′) and 90 dpci (D,D′). (E,E′,G,G′) Immunostaining for RFP (cECs, magenta) and PCNA (proliferation marker, green) with DAPI (blue) counterstaining on sections of cryoinjured ventricles from Tg(-0.8flt1:RFP);flt1+/+ (n=5, E) and Tg(-0.8flt1:RFP);flt1−/− (n=4, E′) zebrafish, and from Tg(-0.8flt1:RFP) (Ctrl, n=4, G) and Tg(-0.8flt1:RFP);Tg(hsp70l:sflt1) (n=4, G′) zebrafish at 96 hpci. Arrowheads indicate PCNA+ cECs. Areas outlined are shown at higher magnification on the right. (F,H) Percentage of PCNA+ cECs in the border zone and injured area (BZI) of the indicated genotypes at 96 hpci. (I,I′,K,K′) Immunostaining for Aldh1a2 (activated endocardium, white) on sections of cryoinjured ventricles from flt1+/+ (n=6, I) and flt1−/− (n=7, I′) zebrafish at 96 hpci, and from non-transgenic Ctrl (n=4, K) and Tg(hsp70l:sflt1) (n=5, K′) zebrafish at 7 dpci. Red lines indicate the extent of activated endocardium in the injured area. (J,L) Percentage of Aldh1a2+ injured area from the indicated genotypes. Orange and white dotted lines indicate the injured area. Scale bars: 100 µm. Data are mean±s.e.m. (two-tailed, unpaired Student's t-test with P values shown in the graphs).

flt1 modulation alters cardiomyocyte regeneration and scarring after cardiac cryoinjury. (A,A′,E,E′) Immunostaining for Mef2 (CM nuclei, magenta) and N2.261 (embryonic myosin heavy chain, green) with DAPI (blue) counterstaining on sections of cryoinjured ventricles from flt1+/+ (n=5, A) and flt1−/− (n=5, A′) zebrafish, and from non-transgenic Ctrl (n=4, E) and Tg(hsp70l:sflt1) (n=4, E′) zebrafish at 7 dpci. Arrowheads indicate N2.261+ CMs. Areas outlined are shown at higher magnification on the right. White dotted lines indicate the injured area. (B,F) Percentage of N2.261+ CMs in the border zone of the indicated genotypes at 7 dpci. (C,C′,G,G′) Immunostaining for Mef2 (CM nuclei, magenta) and PCNA (green) with DAPI (blue) counterstaining on sections of cryoinjured ventricles from flt1+/+ (n=6, C) and flt1−/− (n=6, C′) zebrafish, and from non-transgenic Ctrl (n=4, G) and Tg(hsp70l:sflt1) (n=4, G′) zebrafish at 7 dpci. Arrowheads indicate PCNA+ CMs. Areas outlined are shown at higher magnification on the right. White dotted lines indicate the injured area. (D,H) Percentage of PCNA+ CMs in the border zone of the indicated genotypes at 7 dpci. (I,I′,M,M′) AFOG staining on sections of cryoinjured ventricles from flt1+/+ (n=10, I) and flt1−/− (n=12, I′) zebrafish, and from non-transgenic Ctrl (n=8, M) and Tg(hsp70l:sflt1) (n=7, M′) zebrafish at 90 dpci. Orange, muscle; red, fibrin; blue, collagen. Black and red dotted lines delineate the scar and regenerated muscle wall areas, respectively. (J,L) Percentage of scar area relative to ventricular area in the indicated genotypes at 90 dpci. (K,N) Graphs showing the representation of groups of different scar area sizes in the indicated genotypes at 90 dpci. Scale bars: 100 µm. Data are mean±s.e.m. (two-tailed, unpaired Student's t-test with P values shown in the graphs).

flt1 deletion causes the upregulation of endothelial MAPK/ERK signaling and the downregulation of egr3 expression during cardiac regeneration. (A,B) Heat-map (A) and RT-qPCR validation (B) showing differentially regulated genes of interest in the border zone and injured area (BZI) of cryoinjured ventricles from flt1+/+ and flt1−/− zebrafish at 96 hpci. (C,C′) Immunostaining of cryoinjured ventricles from flt1+/+ (n=4, C) and flt1−/− (n=4, C′) zebrafish at 96 hpci for pERK (phosphorylated ERK, white). Red lines indicate the range of pERK+ injured area. Dotted orange line indicates the injured area. (D) Quantification of the percentage of pERK+ injured area in the indicated genotypes at 96 hpci. (E,E′) Immunostaining for pERK (green) and EGFP (cECs, magenta) with DAPI (blue) counterstaining on sections of cryoinjured ventricles from Tg(flt1:Mmu.Fos-EGFP);flt1+/+ (n=4, E) and Tg(flt1:Mmu.Fos-EGFP);flt1−/− (n=6, E′) zebrafish at 96 hpci. Arrowheads indicate pERK+ cECs in the BZI. Areas outlined are shown at higher magnification on the right. (F,G) Quantification showing the number (F) and percentage (G) of pERK+ cECs in the BZI of the indicated genotypes at 96 hpci. (H,I) Immunostaining for EGFP (green), MHC (myosin heavy chain, magenta) and Aldh1a2 (red) with DAPI (blue) counterstaining on representative sections from untouched (H) and cryoinjured (I) Pt(egr3:Gal4-VP16);Tg(5xUAS:EGFP) (abbreviated as egr3>EGFP) ventricles at 96 hpci. Arrowheads indicate EGFP+ cells. Areas outlined are shown at higher magnification on the right. White dotted lines indicate the injured area. epi, epicardium. Scale bars: 100 µm. Data are mean±s.e.m. (two-tailed, unpaired Student's t-test with P values shown in the graphs).

flt1 deletion limits myofibroblast differentiation. (A) Immunostaining for EGFP (green), Aldh1a2 (magenta) and α-SMA (myofibroblasts, red) with DAPI (blue) counterstaining on representative sections of cryoinjured egr3>EGFP ventricles at 7 dpci. White and orange arrowheads indicate the EGFP+Aldh1a2+ EdCs and α-SMA+ cells, respectively. (B) Proportion of EGFP+ EdCs within the wound of cryoinjured egr3>EGFP ventricles (n=3) at 7 dpci (see Table S4 for raw data). (C) Immunostaining for GFP (yellow), Aldh1a2 (cyan) and Vim (fibroblasts/myofibroblasts, magenta) with DAPI (blue) counterstaining on representative sections of cryoinjured egr3>EGFP ventricles at 7 dpci. Arrowheads indicate the EGFP+Aldha1a+Vim+ EdCs. (D-D″,F,F′) Immunostaining for MHC (magenta) and α-SMA (white) on sections of cryoinjured ventricles from Ctrl [n=5 for egr3 OE, n=6 for Tg(hsp70l:Cre);egr3flox/flox, D], egr3 OE (n=5, D′) and Tg(hsp70l:Cre);egr3flox/flox (n=5, D″) zebrafish, and from flt1+/+ (n=5, F) and flt1−/− (n=5, F′) zebrafish at 7 dpci. (E,G) Quantification of α-SMA+ cell number within the wound of the indicated genotypes at 7 dpci. (H,H′) Immunostaining for Aldh1a2 (magenta) and α-SMA (yellow) with DAPI (cyan) counterstaining on sections of cryoinjured flt1+/+ (n=4, H) and flt1−/− (n=4, H′) ventricles at 7 dpci. Arrowheads indicate endocardial-associated α-SMA+ cells. (I) Quantification of endocardial-associated α-SMA+ cell number within the wound on ventricular sections of the indicated genotypes at 7 dpci. White and orange dotted lines indicate the injured area. Areas outlined are shown at higher magnification on the right in A,C,H and H′. Scale bars: 100 µm. Data are mean±s.e.m. (two-tailed, unpaired Student's t-test with P values shown in the graphs).

flt1 deletion promotes cardiomyocyte repopulation by downregulating egr3. (A-A″) Phalloidin staining for F-actin (white) on 50 μm sections of cryoinjured ventricles from Ctrl [n=6 for egr3 OE, n=5 for Tg(hsp70l:Cre);egr3flox/flox, A], egr3 OE (n=6, A′) and Tg(hsp70l:Cre);egr3flox/flox (n=5, A″) zebrafish at 7 dpci. Orange arrowheads indicate the protruding CMs in the injured area; orange dotted lines indicate the injured area. (B,C) Quantification of CM protrusion length (B) and number (C) in the indicated genotypes at 7 dpci. (D,D′) Phalloidin staining for F-actin (white) on 50 μm sections of cryoinjured ventricles from flt1+/+ (n=5, D) and flt1−/− (n=5, D′) zebrafish at 7 dpci. Orange arrowheads indicate the protruding CMs in the injured area; orange dotted lines indicate the injured area. (E,F) Quantification of CM protrusion length (E) and number (F) in the indicated genotypes at 7 dpci. (G,G′) Immunostaining for Mef2 (CM nuclei, magenta) and PCNA (green) with DAPI (blue) counterstaining on sections of cryoinjured ventricles from Tg(hsp70l:Cre);egr3+/+ (n=5, G) and Tg(hsp70l:Cre);egr3flox/flox (n=5, G′) sibling zebrafish at 7 dpci. Arrowheads indicate PCNA+ CMs. Areas outlined are shown at higher magnification on the right. (H) Percentage of PCNA+ CMs in the border zone of the indicated genotypes at 7 dpci. (I,I′) AFOG staining on sections of cryoinjured non-transgenic Ctrl (n=6, I) and egr3 OE (n=7, I′) ventricles at 90 dpci. Orange, muscle; red, fibrin; blue, collagen. Black and red dotted lines delineate the scar and regenerated muscle wall areas, respectively. (J) Percentage of scar area relative to ventricular area in the indicated genotypes at 90 dpci. (K) Graphs showing the representation of groups of different scar area sizes in the indicated genotypes at 90 dpci. Scale bars: 100 µm. Data in C,F,H,J are mean±s.e.m. (two-tailed, unpaired Student's t-test with P values shown in the graphs). Data in B,E are mean±s.d. (two-tailed, Mann–Whitney U test with P values shown in the graphs).

Acknowledgments
This image is the copyrighted work of the attributed author or publisher, and ZFIN has permission only to display this image to its users. Additional permissions should be obtained from the applicable author or publisher of the image. Full text @ Development