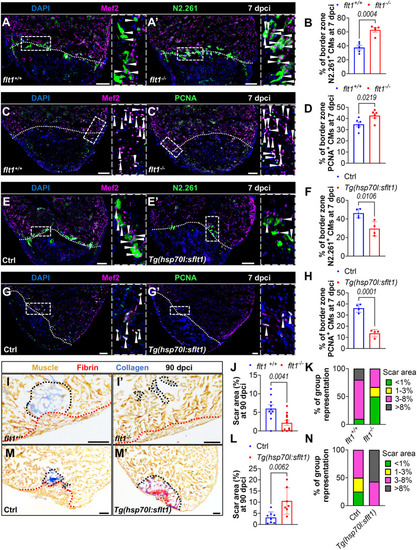
flt1 modulation alters cardiomyocyte regeneration and scarring after cardiac cryoinjury. (A,A′,E,E′) Immunostaining for Mef2 (CM nuclei, magenta) and N2.261 (embryonic myosin heavy chain, green) with DAPI (blue) counterstaining on sections of cryoinjured ventricles from flt1+/+ (n=5, A) and flt1−/− (n=5, A′) zebrafish, and from non-transgenic Ctrl (n=4, E) and Tg(hsp70l:sflt1) (n=4, E′) zebrafish at 7 dpci. Arrowheads indicate N2.261+ CMs. Areas outlined are shown at higher magnification on the right. White dotted lines indicate the injured area. (B,F) Percentage of N2.261+ CMs in the border zone of the indicated genotypes at 7 dpci. (C,C′,G,G′) Immunostaining for Mef2 (CM nuclei, magenta) and PCNA (green) with DAPI (blue) counterstaining on sections of cryoinjured ventricles from flt1+/+ (n=6, C) and flt1−/− (n=6, C′) zebrafish, and from non-transgenic Ctrl (n=4, G) and Tg(hsp70l:sflt1) (n=4, G′) zebrafish at 7 dpci. Arrowheads indicate PCNA+ CMs. Areas outlined are shown at higher magnification on the right. White dotted lines indicate the injured area. (D,H) Percentage of PCNA+ CMs in the border zone of the indicated genotypes at 7 dpci. (I,I′,M,M′) AFOG staining on sections of cryoinjured ventricles from flt1+/+ (n=10, I) and flt1−/− (n=12, I′) zebrafish, and from non-transgenic Ctrl (n=8, M) and Tg(hsp70l:sflt1) (n=7, M′) zebrafish at 90 dpci. Orange, muscle; red, fibrin; blue, collagen. Black and red dotted lines delineate the scar and regenerated muscle wall areas, respectively. (J,L) Percentage of scar area relative to ventricular area in the indicated genotypes at 90 dpci. (K,N) Graphs showing the representation of groups of different scar area sizes in the indicated genotypes at 90 dpci. Scale bars: 100 µm. Data are mean±s.e.m. (two-tailed, unpaired Student's t-test with P values shown in the graphs).
|
