
- Title
-
New application of ombuoside in protecting auditory cells from cisplatin-induced ototoxicity via the apoptosis pathway
- Authors
- Wu, X., Peng, X., Zhang, Y., Peng, W., Lu, X., Deng, T., Nie, G.
- Source
- Full text @ Heliyon

Ombuoside protects HEI-OC1 cells from cisplatin toxicity. A. HEI-OC1 cells were treated with varying concentrations of ombuoside doses for 24 h. Cell viability was analyzed by cell counting kit-8 (CCK-8) and compared with untreated cells, N ≥ 5 B. HEI-OC1 cells were pre-treated with varying concentrations of ombuoside for 2 h and then co-treated with 30 μmol/L cisplatin for 24 h. Cell viability was evaluated by CCK-8 and compared with cells treated with cisplatin alone, N ≥ 4. Data are presented as mean ± SEM. ∗P ≤ 0.05, ∗∗P ≤ 0.01, ∗∗∗P ≤ 0.001, and ∗∗∗∗P ≤ 0.0001. |

Ombuoside protects HEI-OC1 cells against cisplatin-induced apoptosis. A. Cell apoptosis analysis by flow cytometry. Negative autofluorescence control (using untreated cells without dyes) and positive controls (using fixed untreated cells stained with AX or PI) were employed to set the parameters of the cytometer. Comparison between cells treated with cisplatin alone and co-treated with ombuoside, N = 3. The upper right quadrant (Q2) represents apoptotic cells. B. Quantification of apoptotic cells in Fig. 2A, N = 3. Data are presented as mean ± SEM. ∗∗∗∗P ≤ 0.0001. C. Western blot showing the expression of apoptosis-associated proteins in HEI-OC1 cells treated with cisplatin alone and co-treated with ombuoside using tubulin as a reference. (The non-adjusted blot image is included in supplementary material) D. Quantification of protein expression in Fig. 2C. Data are presented as mean ± SEM. ∗P ≤ 0.05, ∗∗P ≤ 0.01, ∗∗∗P ≤ 0.001, and ∗∗∗∗P ≤ 0.0001. |

Ombuoside protects HEI-OC1 cells against cisplatin-induced reactive oxygen species (ROS) and mitochondrial membrane potential (MMP). A–D. Immunofluorescence detection of apoptotic cells by staining for cleaved caspase 3 (green) and nuclei (blue)by 4′,6-diamidino-2-phenylindole (DAPI), N = 3.E–H. Detection of mitochondrial ROS (mtROS) levels using MitoSOX Red vmtROS (red), N = 3. I–L. Measurement of intracellular total ROS (green) using a CellROX Green probe, N = 3. M − P Measurement of the MMP using MitoTracker® Red probe (red), N = 3. Scale bar: 50 μm. Q-T. Quantification of positive cell in Fig. .3A–P. The percentage value was obtained from the ratio of positive cell number to total cell number in the same view field at the same magnification by manually counting. Data are presented as mean ± SEM. ∗∗∗∗P ≤ 0.0001. |

Ombuoside protects against cisplatin-induced damage in cochlear hair cells. A–L. Myosin VII (green) and DAPI (blue) immunofluorescence staining in the apex (A–D), middle (E–H), and base (I–L) regions of the cochlea according to drug treatment, N ≥ 3. M–O. Counts of myosin VII-positive hair cells every 100 μm along the apex (M), middle (N), and base (O) regions of cochlear explants, N ≥ 3. Data are presented as mean ± SEM. ∗P ≤ 0.05, ∗∗P ≤ 0.01, ∗∗∗P ≤ 0.001, and ∗∗∗∗P ≤ 0.0001. Scale bar: 50 μm. |

Effects of ombuoside and cisplatin on apoptosis in cochlear explants. A–L. Detection of apoptotic cells in cochlear explants using terminal deoxynucleotidyl transferase dUTP nick end labeling (TUNEL) (red), and hair cells stained with myosin VII (green) in the apex (A–D), middle (E–H), and base (I–L) regions of the cochlea, N = 4. M–O. Counting of TUNEL-positive hair cells every 100 μm along the apex (M), middle (N), and base (O) regions of cochlear explants, N = 4. Data are presented as mean ± SEM. ∗P ≤ 0.05, ∗∗P ≤ 0.01, ∗∗∗P ≤ 0.001, and ∗∗∗∗P ≤ 0.0001. Scale bar: 25 μm. |
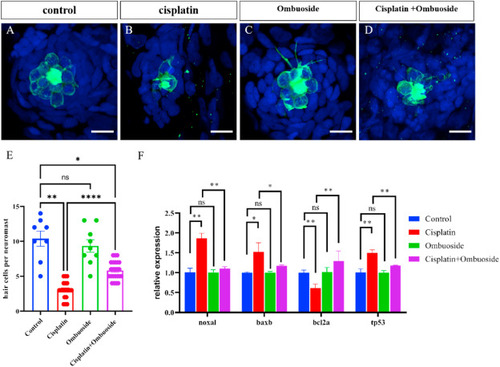
Ombuoside protects zebrafish hair cells from cisplatin-induced damage. A–D. Tg(brn3c:GFP) Zebrafish larvae at 5 dpf were pre-exposed in ombuoside for 2 h, and then co-treated with 800 μmol/L cisplatin for 8 h. Confocal microscopy was used to detect the green fluorescent protein (GFP) expression of hair cells, N ≥ 8. E. Assessment of the number of hair cells per neuromast in Fig. .6A–D, N ≥ 8.F. Relative expression of apoptosis-associated mRNA in zebrafish treated with cisplatin alone or co-treated with ombuoside, N = 3. Data are presented as mean ± SEM. ∗P ≤ 0.05, ∗∗P ≤ 0.01, ∗∗∗P ≤ 0.001, and ∗∗∗∗P ≤ 0.0001. Scale bar: 10 μm. |