
- Title
-
An mTOR-Tfeb-Fabp7a Axis Ameliorates bag3 Cardiomyopathy via Decelerating Cardiac Aging
- Authors
- Ding, Y., Ma, X., Yan, F., Yoon, B., Wei, W., Zhang, Y., Lin, X., Xu, X.
- Source
- Full text @ Aging Cell
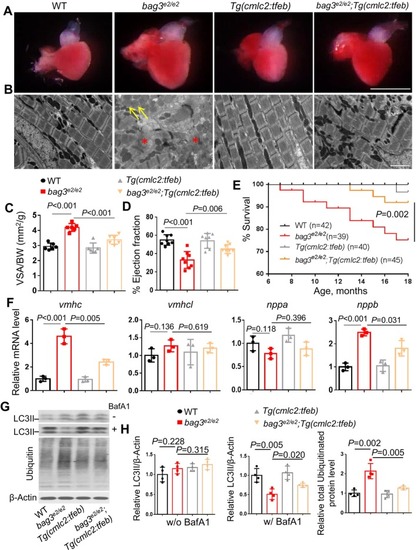
Cardiomyocyte‐specific overexpression of tfeb alleviated bag3 cardiomyopathy phenotypes and restored impaired proteostasis. (A–C) Bright‐field images of dissected hearts (A) confirmative images of transmission electron microscope (TEM) (B) and quantification analysis (C) show enlarged ventricular surface area (VSA) normalized to body weight (BW), impaired sarcomere structure (Asterisks), and mitochondrial swelling (Arrows) phenotypes in the |

Cardiomyocyte‐specific overexpression of |

Combination of RNA‐seq with an F0‐based genetic screen identified |
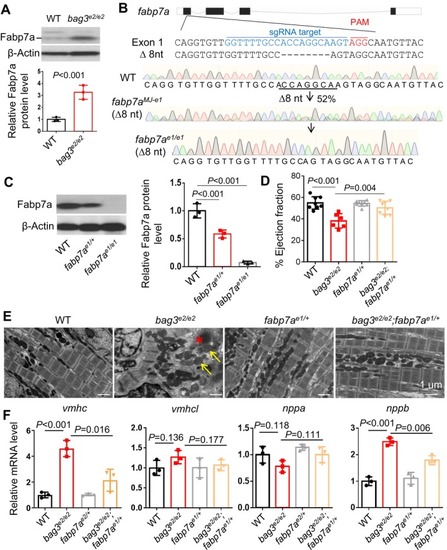
The therapeutic modifying effects of |
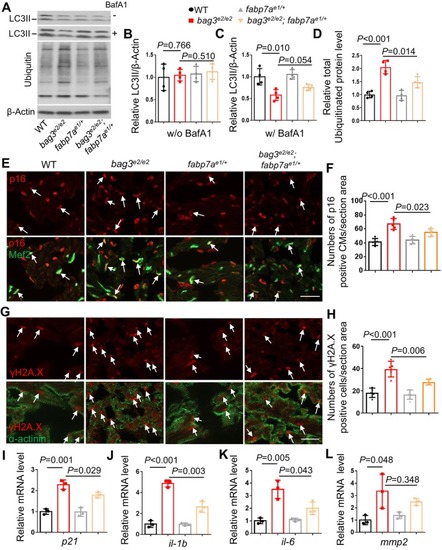
|
Cardiomyocyte‐specific overexpression of |
Cardiomyocyte‐specific overexpression of |
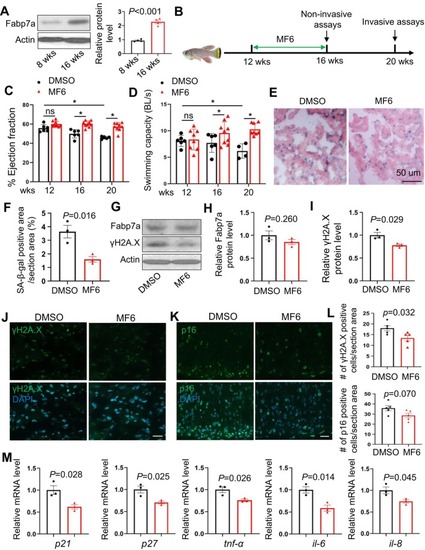
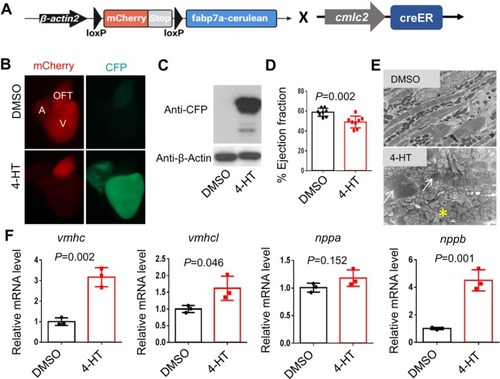
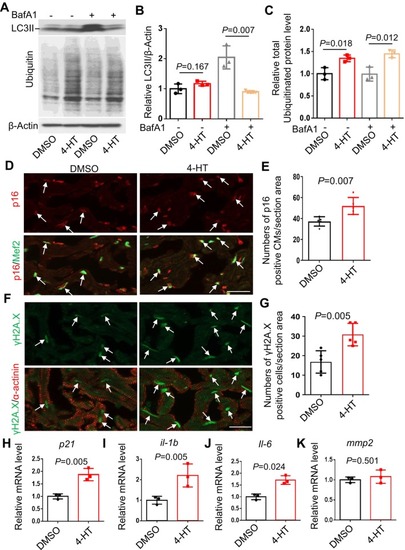
MF6 treatment decelerated cardiac aging indices during normative aging in the turquoise killifish. (A) Representative Western blot and quantification analysis of the Fabp7a protein expression in 8‐week‐old versus 16‐week‐old killifish. |