
Fig. 5
- ID
- ZDB-FIG-190528-4
- Publication
- Bose et al., 2018 - Neuromuscular junction abnormalities in a zebrafish loss-of-function model of TDP-43
- Other Figures
- All Figure Page
- Back to All Figure Page
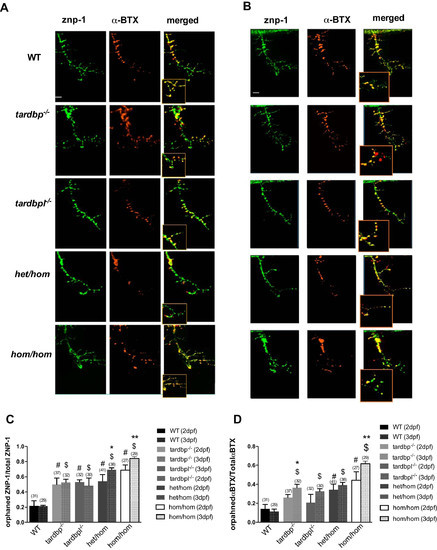
Significantly compromised neuromuscular junction (NMJ) connectivity in hom/hom mutants. A: representative images of one ventral root projection at 2 days postfertilization (dpf) labeled with synaptotagmin 1 (ZNP-1; presynaptic marker), sulforhodamine-conjugated α-bungarotoxin (αBTX; postsynaptic marker), and merged. B: representative images of one ventral root projection at 3 dpf labeled with ZNP-1 (presynaptic marker), sulforhodamine-conjugated αBTX (postsynaptic marker), and merged. Wild-type (WT) larvae demonstrate tight colocalization of both ZNP-1 and αBTX (merged). Scale bar is 25 μm for all images. C: quantification of orphaned ZNP-1 puncta to total ZNP-1 puncta. At 2 dpf, all other genotypes displayed significantly greater orphaned ZNP-1 puncta compared with WT larvae (one-way ANOVA, post hoc Tukey’s test; #P < 0.05). At 3dpf, all other genotypes displayed significantly greater orphaned ZNP-1 puncta compared with WT larvae (one-way ANOVA, post hoc Tukey’s test; $P < 0.05). Paired t-test between the same group at 2 and 3 dpf indicates a significant difference in het/hom and hom/hom mutants (paired t-test; *P < 0.05; **P < 0.01). D: quantification of orphaned αBTX puncta to total αBTX puncta. At 2 dpf, all other genotypes displayed significantly greater orphaned ZNP-1 puncta compared with WT larvae (one-way ANOVA, post hoc Tukey’s test; #P < 0.05). At 3dpf, all other genotypes displayed significantly greater orphaned ZNP-1 puncta compared with WT larvae (one-way ANOVA, post hoc Tukey’s test; $P < 0.05). Paired t-test between the same group at 2 and 3 dpf indicates a significant difference in tardbp−/− and hom/hom mutants (paired t-test; *P < 0.05; **P < 0.01). Data are means ± SE. Numbers in parentheses indicate sample sizes.
|
| Gene: | |
|---|---|
| Antibody: | |
| Fish: | |
| Anatomical Terms: | |
| Stage Range: | Long-pec to Protruding-mouth |
| Fish: | |
|---|---|
| Observed In: | |
| Stage Range: | Long-pec to Protruding-mouth |