|
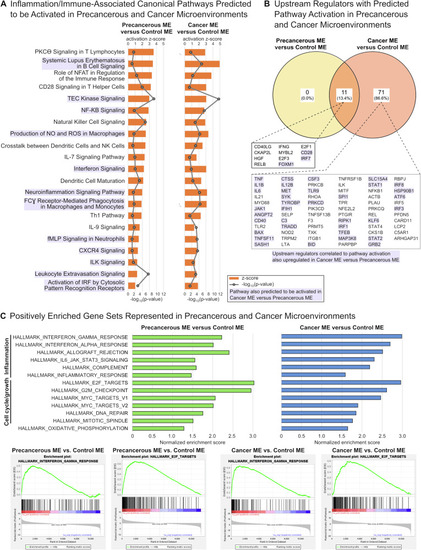
Pathway and gene set enrichment analyses suggest activation of pro-inflammatory and pro-growth signaling in precancerous and cancer cellular microenvironments. A Inflammation and immune-associated canonical pathways identified by Ingenuity Pathways Analysis (IPA) that were predicted to be activated for comparisons of precancerous versus control and cancer versus control microenvironments (MEs). Orange bars represent activation z-score with predicted pathway activation; grey lines represent −log10(enrichment p value); purple shading indicates pathways that were also predicted to be activated in the comparison of cancer versus precancerous microenvironments (Table S1). B Genetic upstream regulators associated with predicted pathway activation as identified by IPA that were significantly upregulated in each comparison. Purple shading indicates genetic upstream regulators associated with predicted pathway activation pathways that were also significantly upregulated in the comparison of cancer versus precancerous MEs (Table S2). C Gene set enrichment analysis (GSEA) identified 13 hallmark gene sets with positive normalized enrichment scores (NES) in both precancerous and cancer MEs versus the control ME. All 13 gene sets also had positive NES in the comparison of cancer versus precancerous MEs (Table S3). These commonly enriched hallmark gene sets were predominantly associated with inflammation or cell cycle/cell growth processes.
|