FIGURE

Fig. 5

ID
ZDB-FIG-250118-48
Publication
Cero et al., 2024 - Profiling the cancer-prone microenvironment in a zebrafish model for MPNST
Other Figures
All Figure Page
Back to All Figure Page
Fig. 5

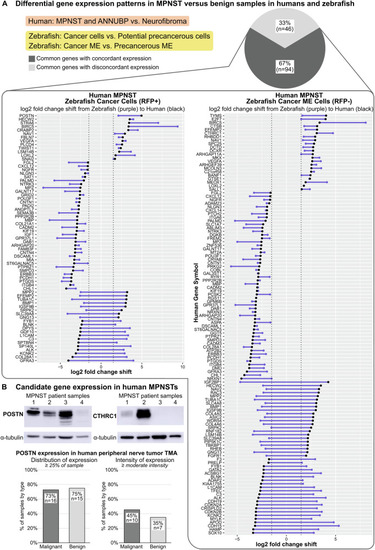
Comparative genomics analysis and candidate gene evaluation in human patient samples identifies potential contributors to MPNST progression.

A Comparison of gene expression profiles for malignant versus benign samples in humans (MPNST and ANNUBP versus neurofibroma) and zebrafish (cancer cells versus potential precancerous cells; cancer microenvironment (ME) versus precancerous ME). Dots represent log2 fold changes per gene for human (black dots) and zebrafish (purple dots) comparisons and connecting lines (purple) depict the relative shift in log2 fold change value. B Expression of candidate genes POSTN and CTHRC1 in human MPNST specimens detected by Western blotting and immunohistochemistry. ANNUBP, atypical neurofibromatosis neoplasm of unidentified biologic potential; TMA, tissue microarray.

Expression Data

Expression Detail
Antibody Labeling
Phenotype Data

Phenotype Detail
Acknowledgments
This image is the copyrighted work of the attributed author or publisher, and ZFIN has permission only to display this image to its users. Additional permissions should be obtained from the applicable author or publisher of the image. Full text @ Oncogene