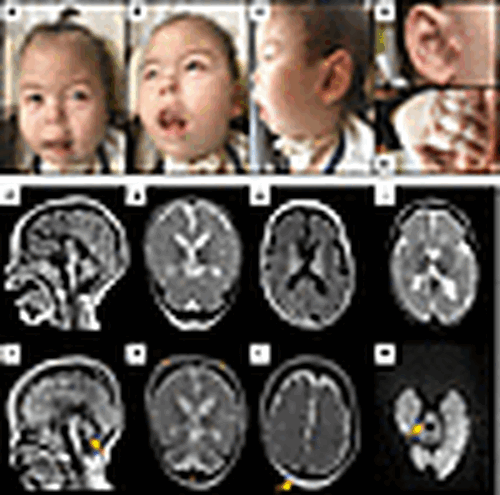
Fig. 1
- ID
- ZDB-FIG-250602-1
- Publication
- Bögershausen et al., 2025 - SEC24C deficiency causes trafficking and glycosylation abnormalities in an epileptic encephalopathy with cataracts and dyserythropoeisis
- Other Figures
- All Figure Page
- Back to All Figure Page
|
Clinical findings and MRI results of individual V-8. (A–C) Note full cheeks, small nose with hypoplastic alae, hypoplastic malar region, long philtrum, arched and thin upper lip, gingival hypertrophy, right preauricular tags (D), and tapering fingers (E). (F–I) Cranial MRI at the age of 7 months and 14 months (J–M). T1-weighted sagittal (F and J) and T2-weighted coronal images (G and K) showing thin corpus callosum, progressive cerebellar atrophy (yellow arrow), cerebral atrophy with enlarged lateral ventricles, and enlargement of calvarial bones demonstrated by increased bone marrow intensity (yellow asterisks). T1- and T2-weighted transverse images with diffuse hypomyelination pattern (H and I). T2-weighted transverse image shows lack of myelination and increased bilateral parietal subcutaneous fat (yellow arrow) (L). Transverse diffusion weighted image b = 1,000 (M) demonstrates restricted diffusion in dorsal brainstem pathways at the level of the superior cerebellar peduncle (yellow arrow). |

