- Title
-
SEC24C deficiency causes trafficking and glycosylation abnormalities in an epileptic encephalopathy with cataracts and dyserythropoeisis
- Authors
- Bögershausen, N., Cavdarli, B., Nagai, T.H., Milev, M.P., Wolff, A., Mehranfar, M., Schmidt, J., Choudhary, D., Gutiérrez-Gutiérrez, Ó., Cyganek, L., Saint-Dic, D., Zibat, A., Köhrer, K., Wollenweber, T.E., Wieczorek, D., Altmüller, J., Borodina, T., Kaçar, D., Haliloğlu, G., Li, Y., Thiel, C., Sacher, M., Knapik, E.W., Yigit, G., Wollnik, B.
- Source
- Full text @ JCI Insight
|
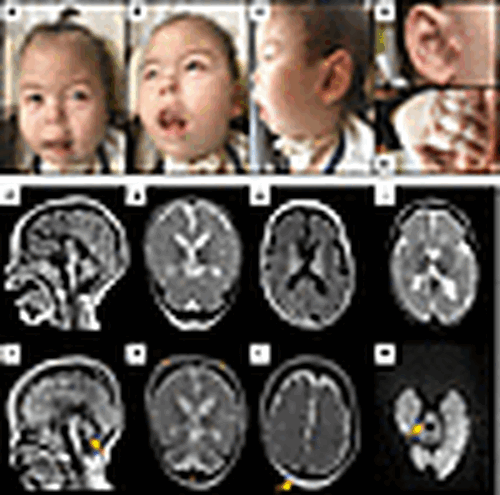
Clinical findings and MRI results of individual V-8. (A–C) Note full cheeks, small nose with hypoplastic alae, hypoplastic malar region, long philtrum, arched and thin upper lip, gingival hypertrophy, right preauricular tags (D), and tapering fingers (E). (F–I) Cranial MRI at the age of 7 months and 14 months (J–M). T1-weighted sagittal (F and J) and T2-weighted coronal images (G and K) showing thin corpus callosum, progressive cerebellar atrophy (yellow arrow), cerebral atrophy with enlarged lateral ventricles, and enlargement of calvarial bones demonstrated by increased bone marrow intensity (yellow asterisks). T1- and T2-weighted transverse images with diffuse hypomyelination pattern (H and I). T2-weighted transverse image shows lack of myelination and increased bilateral parietal subcutaneous fat (yellow arrow) (L). Transverse diffusion weighted image b = 1,000 (M) demonstrates restricted diffusion in dorsal brainstem pathways at the level of the superior cerebellar peduncle (yellow arrow). |
|
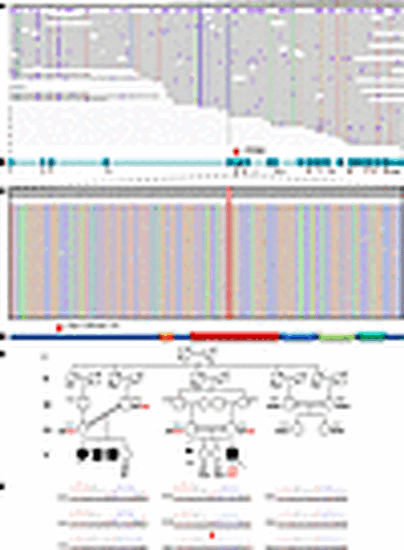
Long-read genome sequencing shows the homozygous c.333del variant. (A) Long reads show robust coverage of SEC24C. (B) Schematic representation of the SEC24C gene. Exons are depicted as blue rectangles and consecutively numbered. (C) Zoom into exon 5 of SEC24C showing the homozygous variant c.333del. (D) Schematic representation of the SEC24C protein. Domains are indicated as colored boxes. Orange: zinc finger domain; red: trunk domain; blue: β-sandwich domain; light green: helical domain; turquoise: gelsolin-like domain. Amino acid positions according to pfam are indicated below the schematic. The variant is indicated by a red arrow in the gene and protein representations. (E) Five-generation pedigree showing consanguineous marriages and cosegregation of the c.333del variant. hom., homozygous for the c.333del variant; wt, wild-type; mut, mutation. (F) Electropherograms showing the SEC24C c.333del variant (red arrow) in individual V-8 (homozygous), his parents (heterozygous), and the affected cousins’ parents (heterozygous). The electropherograms of V-6 and V-7 are not shown, for ethical reasons. |
|
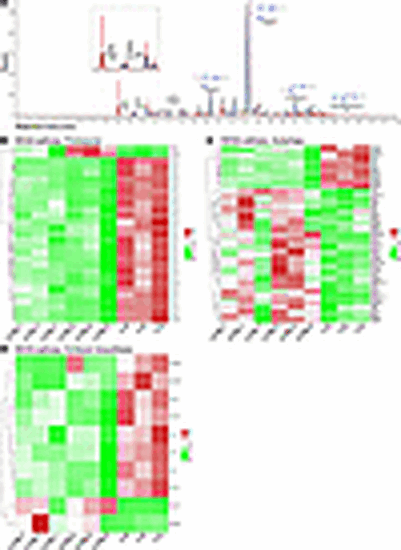
The c.333del variant affects sugar processing as well as several important intracellular pathways. (A) Results of liquid chromatography–mass spectrometry on serum from individual V-8 indicate a mild reduction of galactose and sialic acid residues. Altered peaks are enlarged for clarity or indicated by a red arrow. Heatmaps of deregulated pathways indicate that loss of SEC24C may influence the (B) “proteasome,” (C) “autophagy,” and (D) “N-glycan biosynthesis” pathways (n = 3/group). |
|
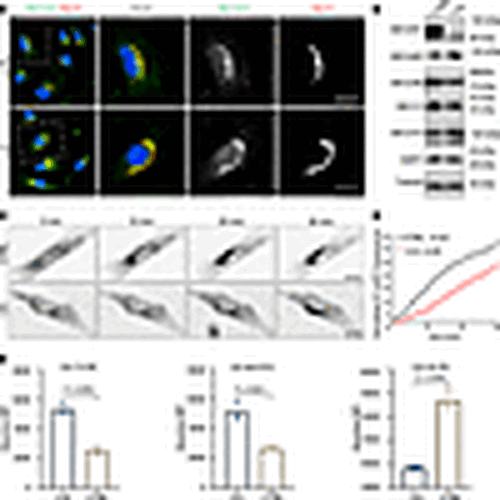
The c.333del p.(Ser112Profs*115) variant affects protein levels of COPII components and intracellular trafficking. (A) The Golgi morphology and the localization of GOSR2 (membrin) are not altered in fibroblasts from individual V-8. Representative confocal images of fibroblasts fixed and stained with antibodies recognizing the endogenous membrin/GOSR2 (green) and the Golgi marker ManII (red). Scale bars represent 25 μm. (B) Representative immunoblot analysis of lysates prepared from control (CTRL) and V-8 fibroblasts and probed for SEC24C, SEC23B, SEC13, SEC31A, SAR1, and tubulin (as a loading control). Molecular size standards are shown to the right of the blots. N = 3. (C) The RUSH assay was performed to assess the traffic between the ER and the Golgi. Representative images from the movies used for the quantification are shown at the indicated time points. Scale bars represent 25 μm. (D) Cells were imaged every 2 minutes after the addition of biotin to release the cargo molecule ST-eGFP from the ER and quantified for control (CTRL) and V-8 fibroblasts. Graph shows normalized ST-eGFP fluorescence in Golgi region (arbitrary units). (E) Surface expression of the GPI-anchored proteins CD55, CD59, and CD73 was assessed by flow cytometry using antibodies specific to each protein and correcting for the background using isotype-specific antibodies. The absolute mean fluorescence intensity (MFI) of samples is shown ± SD, in triplicates. Student’s t test was performed to show the data significance level. |
|
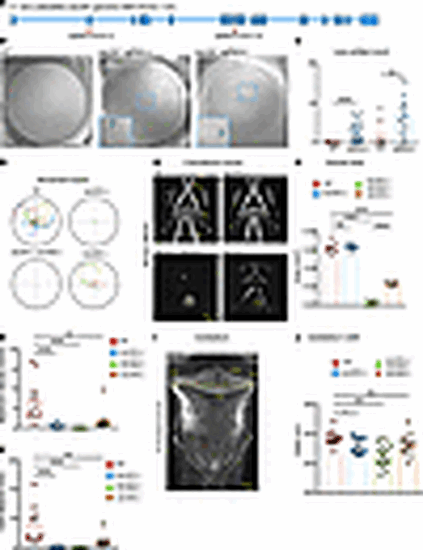
Sec24C CRISPR-edited zebrafish larvae present with lens damage, motility impairment, and smaller cerebellum. (A) Zebrafish sec24C gene overview and localization of single guide RNAs a and b (sgRNA a and sgRNA b), targeting exons 2 and 10, respectively. (B) In situ images of lenses in wild-type, sgRNA a sec24C(–), and sgRNA b sec24C(–) zebrafish larvae at 4 dpf showing lens artifacts. Arrowheads point to droplet-like crystal inclusions in insets. Deep ridges are present along lens circumference in CRISPR-edited lenses. (C) Quantification of lens artifacts in single eye per analyzed animal. Graph represents number of artifacts identified per lens/animal sorted by WT (n = 13), sgRNA a (n = 22), WT (n = 9), and sgRNA b (n = 16). (D) Movement tracks of WT, sec24C(–), sec24C(–) sec24D(–), and sec24D(–) zebrafish larvae at 5 dpf. Each colored line represents an individual animal track (n = 10 per group). (E) Quantification of maximum velocity reached during recorded travel, and (F) total distance traveled by each larva. (G) Whole-mount immunostaining of craniofacial muscles at 5 dpf in WT, sec24C(–), sec24C(–) sec24D(–), and sec24D(–). Scale bar: 100 μm. ima, intermandibularis anterior; imp, intermandibularis posterior; ih, interhyoideus; hh, hyohyoideus; sh, sternohyoideus; h, heart muscle. (H) Quantification of craniofacial muscles area in WT (n = 7), sec24C(–) (n = 6), sec24C(–) sec24D(–) (n = 7), and sec24D(–) (n = 6). (I) Whole-mount immunostaining (5 dpf) for acetylated tubulin (axonal tracks), maximum-intensity projection confocal image of a wild-type cerebellum. Double-headed arrow (yellow) marks cerebellum width. Scale bar: 50 μm. EG, eminentia granularis; LCa, lobus caudalis cerebelli; CCe, corpus cerebelli. (J) Graph of cerebellum width in WT (n = 13), sec24C(–) (n = 13), sec24C(–) sec24D(–) (n = 16), and sec24D(–) (n = 12). Statistics: Graphs show mean ± SEM. (C, H, and J) Student’s t test. (E and F) Mann-Whitney U test. Significance thresholds: *P < 0.05 or Bonferroni-corrected threshold (E, F, H, and J; see Methods), **P < 0.01, ***P < 0.001, ****P < 0.001. |

