
Figure 3
- ID
- ZDB-FIG-251107-72
- Publication
- Li et al., 2025 - PCSK9 Loss-of-Function Disrupts Cellular Microfilament Network via LIN28A/HES5/JMY Axis in Neural Tube Defects
- Other Figures
- All Figure Page
- Back to All Figure Page
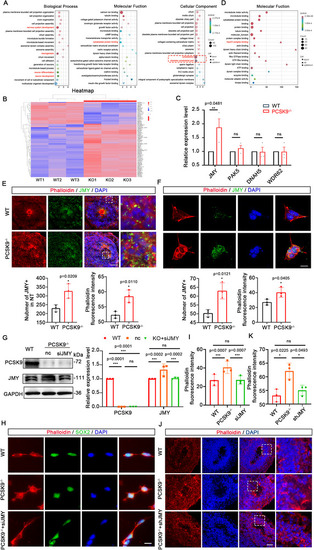
PCSK9 affects NT structure by regulating microfilament network formation in NPCs through JMY. A) Biological process‐, molecular function‐, and cellular component‐related items in the GO analysis. The red box shows the cytoskeletal and obsolete cytoskeletal part‐related items. Different colors represent different q values, ranging from red to blue, with q values increasing from small to large; the smaller the q value, the better the correlation. Graph size represents the number; a larger graph indicates more altered genes. In the entry, ▼ indicates downregulation of the altered gene; ▲ indicates upregulation of the altered gene; and ● indicates both upregulation and downregulation of the altered genes. B) Heat map of all DEGs in cytoskeletal proteins. The three rows on the left are the WT group, and the three rows on the right are the PCSK9‐/‐ group. Red indicates high expression, and blue indicates low expression. C) Statistical results of qPCR validation of the altered genes. D) Molecular function‐related items of cytoskeletal proteins. The red box shows the Arp2/3 complex binding entry where JMY is located. E,F) Immunofluorescence staining (up) and statistical results (down) of the expression and colocalization of JMY and cell microfilaments on the NT structure of NOs (E) and NPCs (F); n = 3 individual experiments; scale bar, 100 µm (E), 10 µm (F). G) WB and quantification of PCSK9 and JMY protein levels in WT and PCSK9‐/‐ NPCs after siJMY rescue experiments; n = 3 individual experiments. H,I) Immunofluorescence staining and fluorescence intensity quantification of cell microfilaments in WT and PCSK9‐/‐ NPCs with and without siJMY rescue; n = 3 plates from WT, PCSK9‐/‐, and PCSK9‐/‐ +siJMY; scale bar, 20 µm. J,K) Immunofluorescence staining and fluorescence intensity quantification of cell microfilaments in WT and PCSK9‐/‐ NT structure with and without shJMY rescue; n = 3 individual NOs; scale bar, 100 µm. Values were mean ± SD. Statistical significance was determined using an unpaired two‐tailed Student's |