FIGURE

Figure 1

ID
ZDB-FIG-260101-71
Publication
Che et al., 2025 - The Mutation of myomiR miR499 Impacts the Intermuscular Bones in Zebrafish
Other Figures
All Figure Page
Back to All Figure Page
Figure 1

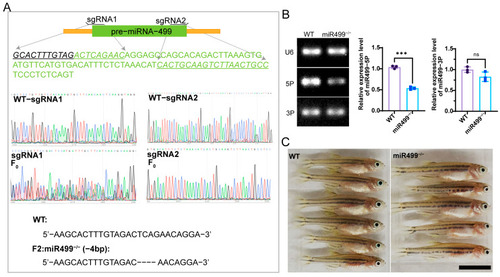
Generation and characterization of miR499 knockout. (A) Schematic illustration of miR499 mutation induction by the CRISPR/Cas9 system with two sgRNAs, and sequencing results of WT and miR499 mutant (F2) with 4—bp deletion (named miR499−/−). Underlined and italicized text indicates the sgRNA target sequence. Green font denotes the pre-miRNA-499 sequence. (B) Semi-quantitative RT-PCR analysis of dre—miR499—5P and dre—miR499—3P expression in WT and miR499−/− fish, with U6 as a loading control. *** p < 0.001. ns: no significance; (C) Representative images of WT and miR499−/− fish at 30 days post-fertilization. Scale bars = 50 mm.

Expression Data
Gene:
Fish:
Anatomical Term:
Stage: Day 6

Expression Detail
Antibody Labeling
Phenotype Data
Fish:
Observed In:
Stage Range: Day 6 to Days 30-44

Phenotype Detail
Acknowledgments
This image is the copyrighted work of the attributed author or publisher, and ZFIN has permission only to display this image to its users. Additional permissions should be obtained from the applicable author or publisher of the image. Full text @ Biology (Basel)