|
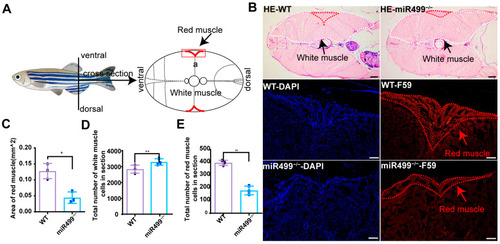
Histological analysis of muscle in WT and miR499−/− zebrafish at 3 months old. (A) Diagrams of body areas of zebrafish used for histological analysis. a represents red muscle; (B) Tissue sections and immunofluorescent staining by HE staining and F59 antibody separately in zebrafish muscle. Red arrows indicate red muscle. White dotted lines outline white muscle areas, and black arrows indicate white muscle. Red dotted lines outline red muscle areas, and red arrows indicate white muscle. Scale bar: 200 µm; (C) Quantification of red muscle area. N = 3. * p < 0.05; (D) Quantification of total number of white muscle cells in section. N = 3. ** p < 0.01. (E) Quantification of total number of red muscle cell. N = 3. ** p < 0.01.
|