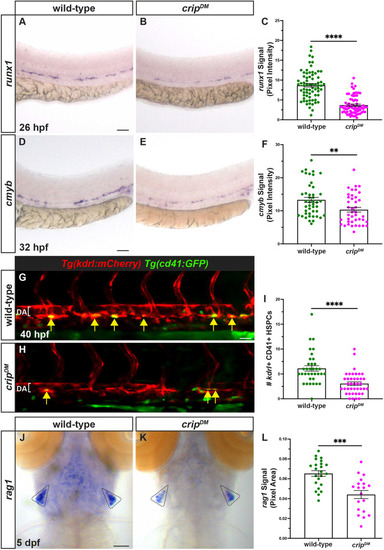
crip2 loss-of-function results in decreased HSPCs and lineage derivatives. (A,B) In situ hybridization (ISH) for runx1 in wild-type (n=70) (A) and cripDM (n=71) (B) embryos at 26 hpf. Lateral views, anterior to the left. Scale bar: 50 µm. (C) Quantification of runx1 signal in the dorsal aorta (DA) from A and B in wild-type and cripDM embryos using pixel intensity analysis. Unpaired two-tailed nonparametric t-test yields a statistically significant difference between wild-type and cripDM (****P<0.0001) embryos. (D,E) ISH for cmyb in wild-type (n=45) (D) and cripDM (n=41) (E) embryos at 32 hpf. Lateral views, anterior to the left. Scale bar: 50 µm. (F) Quantification of cmyb signal in the DA from D and E in wild-type and cripDM embryos using pixel intensity analysis shows a statistically significant reduced signal in cripDM embryos employing an unpaired two-tailed nonparametric t-test (**P=0.0049). (G,H) Live transgenic images of wild-type (n=22) (G) and cripDM (n=36) (H) embryos carrying Tg(kdrl:mCherry);Tg(CD41:GFP) at 40 hpf. Lateral views, anterior to the left. Scale bar: 25 µm. (I) Quantification of HSPCs in wild-type and cripDM embryos denoted by kdrl:mCherry+cd41:GFP+ cells in G and H. Unpaired two-tailed nonparametric t-test yields a statistically significant difference between wild-type and cripDM embryos (****P<0.0001). (J,K) ISH for rag1 in wild-type (n=23) (J) and cripDM (n=19) (K) embryos at 5 dpf. Ventral views, anterior to the top. Dotted triangles indicate rag1 expression. Scale bar: 50 µm. (L) Quantification of the rag1+ area in the thymus of embryos from J and K reveals decreased rag1+ area in cripDM embryos, employing an unpaired two-tailed nonparametric t-test (***P<0.001). Mean and standard error of each dataset are shown.
|
