
FIGURE
FIGURE 2
- ID
- ZDB-FIG-260612-15
- Publication
- Frick et al., 2026 - Virtual Screening and Zebrafish Phenotype-Based Evaluation Argues Against Repurposing 4-Phenylbutyrate for STXBP1-Related Disorders
- Other Figures
- All Figure Page
- Back to All Figure Page
FIGURE 2
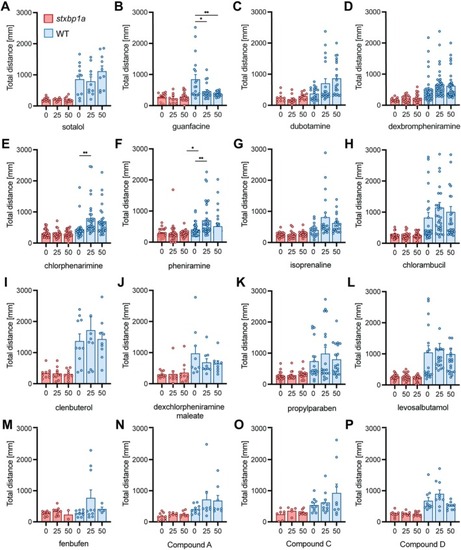
Screening of virtual drug candidates. (A–P) Bar plots of total distance traveled during a 10 min tracking epoch. Data is shown for stxbp1a mutant (salmon) and WT siblings (blue). Each dot represents one fish, comparing each condition to the non‐treatment group (WT). N = 10–30 fish for each concentration and each drug. Date presented as mean ± S.E.M. Significant differences are denoted as **p ≤ 0.01, *p ≤ 0.05. One‐way ANOVA with Dunnett's multiple comparison test. |
Expression Data
Expression Detail
Antibody Labeling
Phenotype Data
Phenotype Detail
Acknowledgments
This image is the copyrighted work of the attributed author or publisher, and
ZFIN has permission only to display this image to its users.
Additional permissions should be obtained from the applicable author or publisher of the image.
Full text @ Pharmacol Res Perspect