
FIGURE 3
- ID
- ZDB-FIG-260612-16
- Publication
- Frick et al., 2026 - Virtual Screening and Zebrafish Phenotype-Based Evaluation Argues Against Repurposing 4-Phenylbutyrate for STXBP1-Related Disorders
- Other Figures
- All Figure Page
- Back to All Figure Page
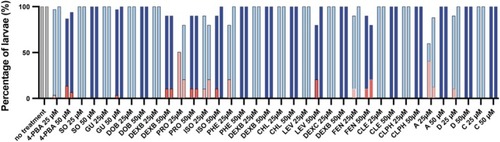
Toxicology assay for larvae following behavioral assessment. Toxicity assessment of all compounds at both concentrations. The left bar for each concentration represents stxbp1a mutants, while the right bar represents WT zebrafish. Light blue and red bars indicate survival and toxicity percentages at 25 μM, respectively, while dark blue and red bars indicate survival and toxicity percentages at 50 μM concentration, respectively. The “no treatment” condition serves as the baseline control with 0 concentration. Survival percentages for both WT and stxbp1a are provided, with overlaid percentages depicting larvae that did not survive treatment. N = 30–60 fish per condition. N (no treatment) = 300 WT and 270 stxbp1a larvae; N = 899 stxbp1a total, N = 990 WT total. Abbreviations: Propylparaben (PRO), dexchlorpheniramine maleate (DEXC), isoprenaline (ISO), levosalbutamol (LEVO), clenbuterol (CLE), pheniramine (PHE), sotalol (SO), fenbufen (FEN), dobutamine (DOB), guanfacine (GU), chlorpheniramine (CLPH), dexbrompheniramine (DEXB), and chlorambucil (CLO). |