
FIGURE
Fig. 1
Fig. 1
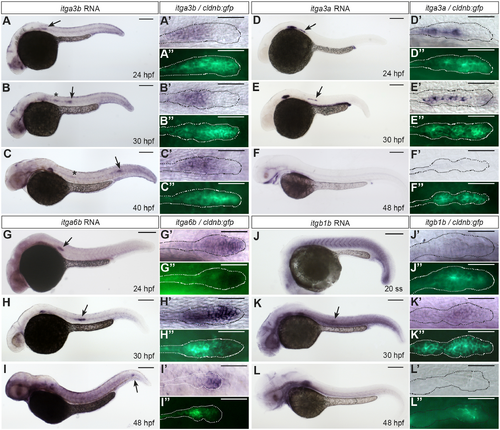
itga3b, itga3a, itga6b and itgb1b are expressed in the migrating primordium.cldnb:GFP embryos were stained by in situ hybridization using riboprobes against itga3b (A-C″), itga3a (D-F″), itga6b (G-I″) and itgb1b (J-L″) at the indicated stages. Arrows mark the migrating pLLP. (A-L) Overview images. (A′-L′) Higher magnifications of the pLLP and (A″-L″) GFP immunostaining to delineate the pLLP. Scale bars: 200 μm in A-L; 50 μm in A′-L″. |
Expression Data
| Genes: | |
|---|---|
| Fish: | |
| Anatomical Terms: | |
| Stage Range: | Prim-5 to Long-pec |
Expression Detail
Antibody Labeling
Phenotype Data
Phenotype Detail
Acknowledgments
This image is the copyrighted work of the attributed author or publisher, and
ZFIN has permission only to display this image to its users.
Additional permissions should be obtained from the applicable author or publisher of the image.
Full text @ Development