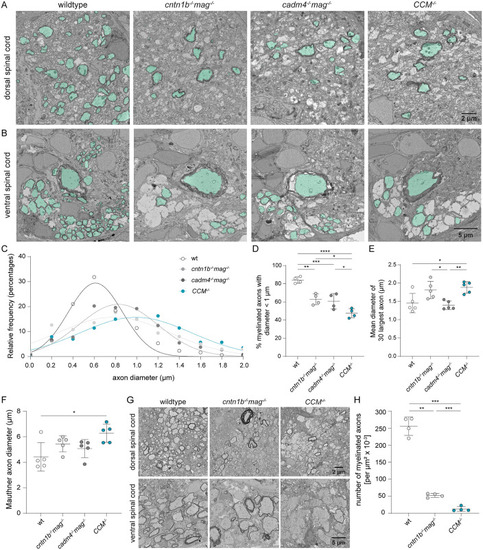
Exacerbated hypomyelination and increased Mauthner axon diameter in the CCM−/− triple knockout.
(A, B) Scanning electron microscopy (SEM) images of cross-section of wild -type, cntn1b−/−mag−/− dKO, cadm4−/−mag−/− dKO, and CCM−/− tKO zebrafish dorsal (A) and ventral (B) spinal cord at 8 dpf. Pseudo-coloring indicates myelinated axons. Scale bar is 2 µm for (A), 5 µm for (B). (C) Quantification of the relative frequency distribution (in percentages) of all the myelinated axons binned by axon diameter. Data points represent means. Lines of best fit with a Gaussian distribution are overlaid. (D) Quantification of the percentage of myelinated axons with an axonal diameter <1 µm. (E) Quantification of the mean diameter of the 30 largest axons, both myelinated and unmyelinated, in the ventral spinal cord. (F) Quantification of the mean Mauthner axon diameter. (G) SEM images of the dorsal and ventral wild-type, cntn1b−/−mag−/− dKO, and CCM−/− tKO zebrafish spinal cord cross-section at 2.5 months. Scalebar is 2 µm (top panels) and 5 µm (lower panels). (H) Quantification of the number of myelinated axons per µm2 in wild type, cntn1b−/−mag−/− dKO, and CCM−/− tKO at 2.5 months. Graphs represent mean values ± SD, analyzed by one-way ANOVA with Tukey’s multiple comparisons test (D–F), and Brown-Forsythe and Welch ANOVA with Dunnett’s T3 multiple comparisons test (H). *p < 0.05, **p < 0.01, ***p < 0.001, ****p < 0.0001. Data was collected from 4 fish (C, D, H) and 5–6 fish (E and F) per genotype. The data underlying this Figure can be found in S1 Data.
|
