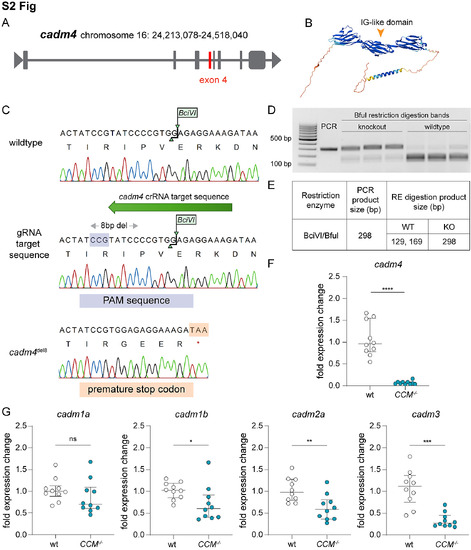
CRISPR-Cas9-mediated gene editing to create cadm4 knockout.
(A) Schematic of the cadm4 gene, where exon 4 (highlighted in red) was chosen as the target exon for CRISPR-Cas9 gene editing. (B) Schematic of the AlphaFold predicted model, obtained from Ensembl, of Cadm4 protein domains in zebrafish. The arrowheads highlight the second extracellular Ig-like domain of the Cadm4 protein that is partly coded for by exon 4. (C) Gene sequence of exon 4 (wild-type allele) selected for CRISPR-Cas9-mediated gene editing. Green arrow indicates the cadm4 gRNA target sequence on the negative strand. Purple highlight indicates the PAM sequence. A frameshift mutation was induced by an 8-basepair (bp) deletion, resulting in a premature stop codon (indicated by red asterisk) in the cadm4 knockout. The loss of the BciVI restriction enzyme recognition sequence confirmed the CRISPR indel mutation. The sequence displayed was obtained by Sanger sequencing. (D) Representative gel electrophoresis image of PCR, followed by restriction digestion-based validation of cadm4 knockout in wild type and CCM−/− tKO. Restriction digestion was performed using BfuI enzyme. The size of the molecular ladder is indicated. (E) Expected PCR and restriction digestion bands for PCR-based validation of KO. (F) qPCR quantification showing the relative cadm4 mRNA expression in wild-type and CCM−/− tKO zebrafish larvae. (G) qPCR quantification showing the relative mRNA expression of cadm gene family members in the CCM−/− tKO. Data was collected from 10 fish per genotype. Graphs represent the median with the interquartile range, and statistical analysis was done using the unpaired two-tailed non-parametric Mann–Whitney test. *p < 0.05, **p < 0.01, ***p < 0.001, ****p < 0.0001. The data underlying this Figure can be found in S1 Data.
|
