Image
Figure Caption

FIGURE 9

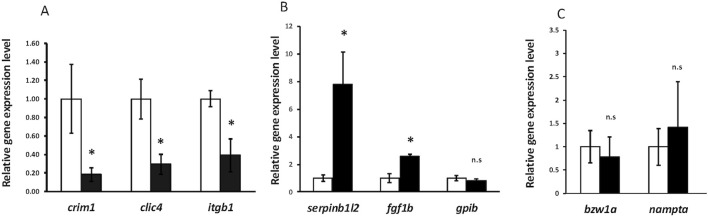
RT-qPCR showing significant downregulation of crim1, clic4, and itgb1 and significant upregulation of serpinb1l2 and fgf1b. (A) RT-qPCR showing expression of crim1, clic4, and itgb1 in crim1−/− larvae compared to controls. RT-qPCR was performed on dissected eyes for all experiments from control (white columns; expression normalized to 1.0) and crim1−/− larvae (black columns) at 72 hpf. The results show significantly reduced expression of crim1 (P = 0.04), clic4 (P = 0.02), and itgb1 (P = 0.02) in crim1−/− larvae compared to controls. (B) RT-qPCR showing expression of serpinb1l2, fgf1b, and gpib in crim1−/− larvae compared to controls. The results show significantly increased expression of serpinb1l2 (P = 0.02) and fgf1b (P = 0.02) but not gpib (P = 0.25) in crim1−/− larvae compared to controls. (C) RT-qPCR showing expression of bzw1a and nampta in crim1−/− larvae compared to controls. The results do not show significantly reduced expression for bzw1a (P = 0.4) or nampta (P = 0.16) in crim1−/− larvae compared to controls.

Figure Data
Acknowledgments
This image is the copyrighted work of the attributed author or publisher, and ZFIN has permission only to display this image to its users. Additional permissions should be obtained from the applicable author or publisher of the image. Full text @ Front Cell Dev Biol