IMAGE

FIGURE 5

ID
ZDB-IMAGE-250417-82
Source
Figures for Kawahara et al., 2025
Image
Figure Caption

FIGURE 5

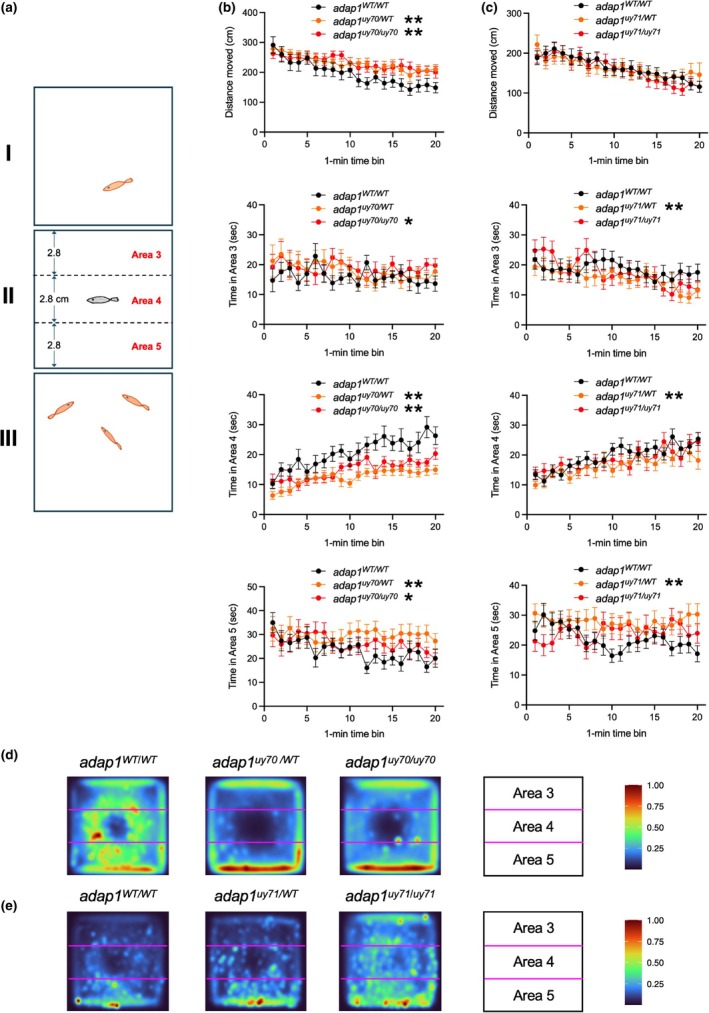
Social behavior analysis of wild‐type and adap1 mutants in the adult stage. (a) Schematic representation of the social behavior test used in this study. Areas 3 and 5 were set as the region near the stimulus exploration. One and three novel conspecifics (e.g., albino line) were placed in chamber I and III, respectively. (b and c) The distance moved by zebrafish in chamber II and the time spent in each area (areas 3, 4, and 5) for each minute. The adap1uy70/WT and adap1uy70/uy70 swam longer than the wild type (WT). The adap1uy70/uy70 stayed longer than the wild type in area 3. The adap1uy71/WT stayed shorter than the wild type in area 3. The adap1uy70/WT, adap1uy70/uy70, and adap1uy71/WT stayed shorter than the wild type in area 4. The adap1uy70/WT, adap1uy70/uy70, and adap1uy71/WT stayed longer than the wild type in area 5. The numbers of zebrafish are Ν = 16 for WT/WT, Ν = 19 for WT/uy70, Ν = 17 for uy70/uy70, Ν = 30 for WT/WT, Ν = 34 for WT/uy71, Ν = 29 for uy71/uy71. *p < 0.05, **p < 0.01. (d and e) Heat map of the behavior of wild‐type and adap1 mutants. The numbers of zebrafish in each group are same in (b and c). A high number of color indicators indicates that zebrafish were frequently located at that position during the 20 min test period.

Figure Data
Acknowledgments
This image is the copyrighted work of the attributed author or publisher, and ZFIN has permission only to display this image to its users. Additional permissions should be obtained from the applicable author or publisher of the image. Full text @ Dev. Growth Diff.